Open Access
Fig. 6
Download original image
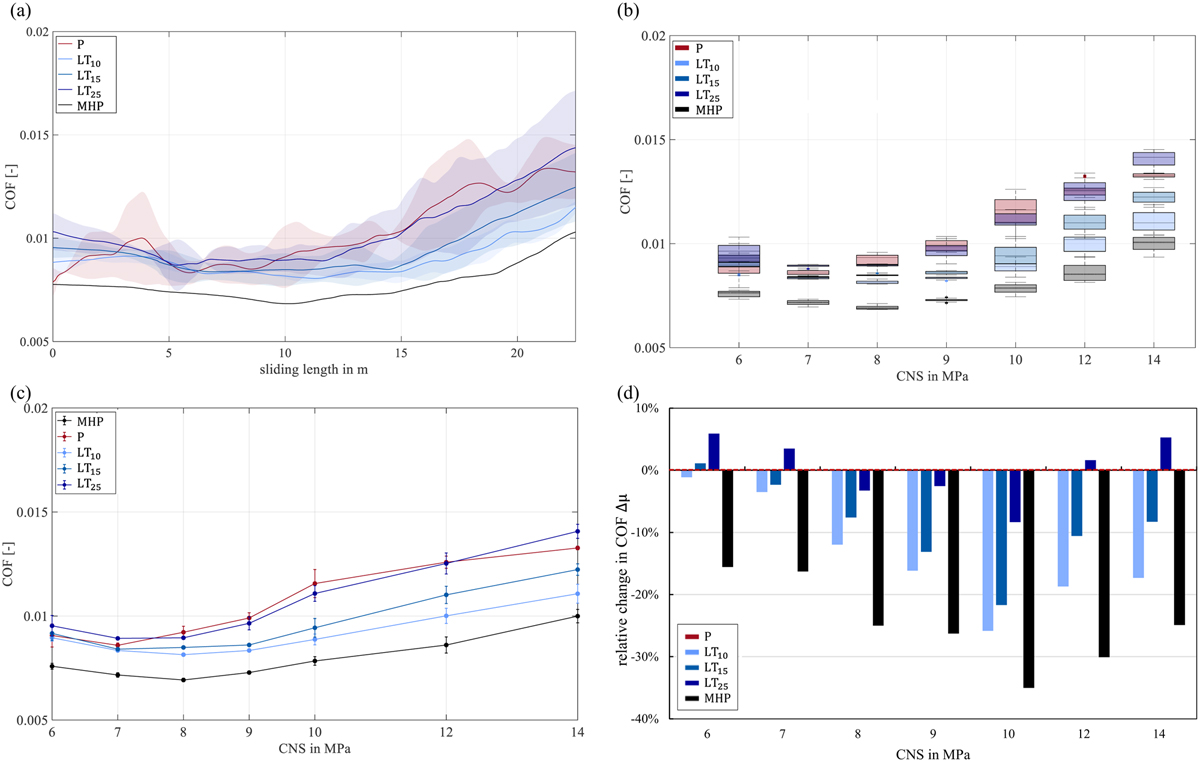
(a) COF for the investigated specimen, (b) boxchart for constant pressure states, (c) evolution and error of COF for constant pressure states and (d) relative change in COF for constant pressure states.
Current usage metrics show cumulative count of Article Views (full-text article views including HTML views, PDF and ePub downloads, according to the available data) and Abstracts Views on Vision4Press platform.
Data correspond to usage on the plateform after 2015. The current usage metrics is available 48-96 hours after online publication and is updated daily on week days.
Initial download of the metrics may take a while.