| Issue |
Manufacturing Rev.
Volume 2, 2015
|
|
|---|---|---|
| Article Number | 9 | |
| Number of page(s) | 6 | |
| DOI | https://doi.org/10.1051/mfreview/2015013 | |
| Published online | 01 May 2015 | |
Research Article
Effects of grain size on the sheared surface in micropiercing of austenitic stainless steel SUS304
1
Komatsuseiki kosakusho Co., Ltd., 942-2 Shiga, Suwa City, Nagano Pref., Japan
2
National Institute of Advanced Industrial Science and Technology, 1-2-1 Namiki, Tsukuba City, Ibaraki Pref., Japan
3
Tokyo Metropolitan University, 6-6 Asahigaoka, Hino City, Tokyo, Japan
* e-mail: This email address is being protected from spambots. You need JavaScript enabled to view it.
Received:
13
February
2015
Accepted:
11
March
2015
Abstract
Over the last decade, development of fine-grained materials and investigation into the effect of different grain sizes on metal forming at the micro-scale have been seen worldwide. There were several technical reports and scientific papers dealing with the quality improvements with use of the ultra-fine grained steel due to the different grain deformations. However, there were few studies concerning effect of the grain size on the sheared surface in micropiercing. In this study, we investigated stability of the sheared surface length of the cross section in micro-pierced holes. The inner diameter of the holes and maximum piercing forces were measured in order to evaluate the effect of the grain size in the micropiercing process. As reducing the material grain size, ratio of the fractured surface and maximum piercing force increased with tendency to tensile strength. However, the ratio of the burnished surface to the fractured surface as well as inner diameter of the pierced holes varied, depending on the grain size of the material. As a result, a suitable grain size should be considered for a micropiercing process.
Key words: Micropiercing / Sheared surface / Grain size / Austenitic stainless steel
© T. Shiratori et al., Published by EDP Sciences, 2015
 This is an Open Access article distributed under the terms of the Creative Commons Attribution License (http://creativecommons.org/licenses/by/4.0), which permits unrestricted use, distribution, and reproduction in any medium, provided the original work is properly cited.
1. Introduction
As sizes of parts become smaller, material grain sizes have an effect on the formed dimensions [1–3], because of increased ratio of a grain to the surface area. Fine-grained steel had been required for high-precision micro-forming [4–6]. Control technologies of material grain size had been developed for austenitic stainless steel, such as JIS-SUS304 [7–11]. When the grain size becomes smaller, tensile strength increases and elongation decreases. Basic stamping characteristics of micropiercing for austenitic stainless steel SUS304 with fine-grained micro structures had also been studied [6, 12–14]. A ratio of shear droop and its variation shrank for smaller grain size [6, 13, 15]. It was also clarified that ratio of burnished surface became smaller and fractured surface ratio became larger for the smaller grain sized materials [13]. It influences not only on dimension but also product functions. Komatsu had clarified the correlation between flow volume variations and shear droop variations when the micropiercing of orifice plate used as gasoline injector [6, 12]. However, the investigations of effects of grain size on the sheared surface in micropiercing were limited. Variation of sheared surface could be correlated to material characteristics and piercing performances.
In this paper, the effects of different grain size on micropiercing are investigated. Four different grain size materials are prepared including normal grain size stainless steel. Micropiercing tools with ϕ80 μm punch are produced. The piercing tool is operated by desktop stamping systems and it is possible to measure the piercing forces during the experiments. After the piercing hole, the length of sheared surfaces are measured, and then its standard deviations are calculated. Measuring surface roughness of fractured surface is difficult, because the surface is on ϕ80 μm round surface. Instead of that, the depth of fractured surface is measured as the diameter of exit hole. Finally, effects of different grain size on the micropiercing are discussed, and the suitable grain size will be introduced in the conclusion.
2. Experiment
2.1. Material properties
Austenitic stainless steels (JIS SUS304) were employed in the experiments. The ultra-fine grained stainless steels were manufactured with repeating plastic deformation and reverse phase transformation. Table 1 shows the chemical composition of the materials.
Chemical composition of presented SUS304 sheet (mass%).
There are four different grain sizes. Average grain sizes of materials were 1.0 μm, 1.5 μm, 3.0 μm, and 7.5 μm. There were defined as “Gs1.0 μm”, “Gs1.5 μm”, “Gs3.0 μm”, “Gs7.5 μm”. From Gs1.0 μm to Gs3.0 μm were ultra-fine grained materials, and Gs7.5 μm was the normal material of SUS304. The thickness of all materials was 100 μm. Figure 1 shows the grain condition by Electron Back Scatter Diffraction (EBSD). These mechanical properties were shown in Table 2.
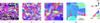 |
Figure 1. EBSD IPF map. (a) Gs1.0 μm, (b) Gs1.5 μm, (c) Gs3.0 μm, (d) Gs7.5 μm. |
Characteristics of material.
2.2. Experiment tools
Desktop press unit (SSI-01) was produced by BISAIKAKOH KENKYUSHO in Figure 2a, and it is controlled by servo motor and the press force was 10 kN. Micropiercing tool was produced for these experiments in Figure 2b. The punch diameter was ϕ80.6 μm and it was manufactured by ultra-fine grained tungsten carbide in Figure 2c. Die diameter was ϕ87.5 μm and it was manufactured by same material of the punch in Figure 2d. The clearance between punch and die was 3.45%. Nano controlled X-Y stage was incorporated in the lower die. The stage is able to control the clearance with accuracy of 10 nm by the digital feedback control systems. The piercing force was measured by the load-cell (KYOWA DENKO LMA-A-50A) above the punch, and piercing position was measured by the laser displacement sensor by KEYENCE LK-G30.
 |
Figure 2. Experiment tools. (a) Desktop press unit, (b) micropiercing tool, (c) SEM image of punch, (d) SEM image of die. |
2.3. Experiment condition
Each material was pierced by one pair of punch and die. Piercing was started from the small grain size “Gs1.0 μm” to “Gs7.5 μm” in order. Pierced forces were measured 20 times. Piercing condition was 40 SPM, in which punching speed was 4.2 mm/s. The cross-sections were observed by SEM from start to fifth hole, evaluated the variation of the sheared surface and the occupancy rate of the sheared surface. Inner diameter of holes from 2 samples of 10th and 11th after start of piercing were measured by PANASONIC UA3P-L. UA3P-L has a 30 μm diameter prove with 0.15 μm accuracy, it is possible to measure the inner diameter of the die tool and micro pierced hole. Small diameter-prove is able to scan in different depth. Average piercing force and standard deviation of maximum piercing force were calculated from shearing diagrams.
3. Results
3.1. Sheared surface
Figure 3 describes the constitution of piercing hole. The punch entrance is determined as “shear droop”. Then, there are “burnished surface” below the hole entrance. “Fractured surface” is located at the bottom of hole which is punch exit. “Burr” will be observed in some case at the edge of fractured surface. The height of shear droop, burnished surface and fractured surface are defined as Hd, Hs, Hf, respectively.
 |
Figure 3. Constitution of sheared surface. |
Figure 4 shows the sheared surface of the micropierced holes, observed by SEM. The surface of burnished surfaces are similar for each grain size, because of punch surface are copied. On the other hand, the roughness of fractured surface is different in the picture, and the height of “Hf” tends to be higher for smaller grained materials.
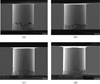 |
Figure 4. SEM image of sheared surface. (a) Gs1.0 μm, (b) Gs1.5 μm, (c) Gs3.0 μm, (d) Gs7.5 μm. |
The entrance shapes are also different. Lenght of “Hd” become higher when the material with larger grain is pierced due to large elongation and lower material hardness. Border line between burnished surface “Hb” and fractured surface “Hf” is observed. When the grain size is smaller, the line becomes wavy.
3.2. Constitution of sheared surface
Constitution ratio of sheared surface is calculated by dividing height of each portion by the material thickness. Figure 5a shows the results from a sample. As is mentioned before, the ratio of burnished surface is decreased when smaller grain is pierced, and shear droops has similar trend due to lower elongation and higher material hardness.
 |
Figure 5. Ratio of the sheared surface and standard deviation. (a) Ratio of the sheared surface, (b) standard deviation of the sheared surface (σ). |
Figure 5b shows the result of standard deviation in the average height of each portion in the sheared surface of 5 samples. The deviations in the burnished and fractured surfaces for grain sizes of 1.0 μm and 1.5 μm had wide variance, while the deviations became smallest for grain size 3.0 μm. However, the deviation increased for larger grain size 7.5 μm.
3.3. Inner diameter of micro-pierced hole
Figure 6 shows the measuring results of inner diameter of “Gs3.0 μm” micropierced hole that measured by UA3P-L. Figure 7 shows the inner diameter of pierced hole from average of 2 samples. The diameter in different depth from burr side is measured. Burnished surfaces are exist from 25 μm to 75 μm. Each material inner diameter of burnished surface is smaller than that of punch diameter of ϕ80.6 μm. The end of shear droop is about 85 μm. In this point, “Gs1.0 μm” has a smallest inner diameter (ϕ80.65 μm). On the other hand, “Gs3.0 μm” has a biggest inner diameter (ϕ80.85 μm). Range of this point is only 0.2 μm. Distance from burr side surface of 15 μm is fractured surface. In this point, range of inner diameter is about 0.7 μm. When the grain size is smaller, elongation and n-value became small. As a result, start point of fractured surface is earlier than that of larger grain size.
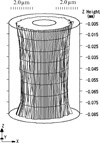 |
Figure 6. Inner diameter measuring result of “Gs3.0 μm” micropierced hole by UA3P-L. |
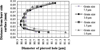 |
Figure 7. Diameter of pierced hole. |
3.4. Maximum piercing force and standard deviation
Figure 8 shows the shearing diagrams at 1st shot of each material. Maximum piercing force is proportional to the tensile strength. When the grain size is smaller, piercing force becomes higher. Figure 9 shows the average maximum piercing force and standard deviation of maximum piercing force in 20 samples. The most stable material of standard deviation of maximum piercing force is the result of grain size 1.0 μm and 1.5 μm. When the grain size is smaller, standard deviation of maximum piercing force becomes smaller.
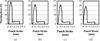 |
Figure 8. Shearing diagrams at 1st shot of each materials. (a) Gs1.0 μm, (b) Gs1.5 μm, (c) Gs3.0 μm, (d) Gs7.5 μm. |
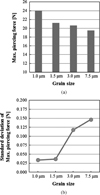 |
Figure 9. Maximum piercing force and standard deviation. (a) Maximum piercing force, (b) standard deviation of maximum piercing force. |
4. Discussion
When material grain sizes become smaller, tensile strength becomes larger and elongation becomes smaller. From the experiments, the length of sheared surface, shear droop and burnished surface become shorter and fractured surface becomes longer (Figure 5a). And piercing force becomes higher (Figure 9a). These characteristics were consistent with which had been revealed in the previous paper [4–6].
From a view point of stability of piercing characteristics, when the grain sizes are smaller, end point of burnished surface and start point of fractured surface becomes unstable (Figure 5b). But, variation of maximum piercing force becomes stable (Figure 9b). On the other hand, variation of end point of burnished surface and start point of fractured surface are stabilized at 3.0 μm. This grain size is near to the blanking clearance [16]. In grain size 7.5 μm, variations of burnished and fractured surface become larger than grain size 3.0 μm. Variation of piercing force becomes larger with bigger grain size. It is considered that effects of material characteristics and grain size.
One of the important things which determine the start point of fractured surface is Hall-Petch law. Normal material such as grain size 7.5 μm, has randomly grain as shown in Figure 1d. Variation of grain size is included in the normal material. This results in the variation of yield stress. When piercing the normal grain material, the punch cross the grain boundaries randomly. It is well known that because of the pile up of dislocations deformation resistance at grain boundary is higher than that inside of grain [3]. Regarding with grain size variation of material and difference of deformation resistance, it is becoming difficult to start the fracture at the same time in micropiercing. Therefore, variation of burnished and fractured surface of normal material (grain size 7.5 μm) becomes larger than grain size 3.0 μm as is shown in Figure 5b. And maximum piercing forces become unstable.
Ultra-fine grained grain size 1.0 μm and grain size 1.5 μm material characteristics are different from normal material with grain size 7.5 μm. Tensile strength and 0.2% proof stress become higher, while elongation and n-value become lower. Moreover for the material with grain size of 1.0 μm and 1.5 μm, the grain size variations become smaller than that of 3.0 μm and 7.5 μm. When piercing the blank with grain sizes of 1.0 μm and 1.5 μm, the stress to fracture is higher. It is presumed that lower elongation and n-value are changing the fracture characteristics from ductility fracture to brittle fracture. When starting fracture, high strain near the punch is accumulated without ductility. Therefore, the area that is able to fracture for the material with grain size of 1.0 μm and 1.5 μm is more spread than grain sizes 3.0 μm and 7.5 μm. Furthermore, border line between burnished surface and fractured surface are becoming wavy (Figures 4a, 4b) and unstable (Figure 5b). But, variation of maximum piercing force becomes stable due to small variation of grain sizes (Figure 9b).
The balance of material characteristics such as elongation and tensile strength is strongly rerated to grain size and these should be important for micropiercing.
It was argued that smaller grains were preferable in terms of product edge quality and its functions. For example, as Komatsu mentioned that, the quality of piercing orifice hole is enhanced and the variation of flow volume is reduced to 80% [6]. If the product needs the quality of entrance edge of orifice or groove edge, smaller grain will be applicable. On the other hand, some of the products such as connector or watch parts use stable burnished surface in micro hole. From the experiment, the grain size of 3.0 μm is the best preference to keep the burnished surface and its length stable. The choice of material grain size by product for stability of sheared surface is with significant importance.
5. Conclusion
This paper reports an investigation into the effect of grain size in micropiercing and the preferable grain size for micropiercing is discussed. When the average grain size is 3.0 μm, the burnished and fractured surface become stable. This grain size is close to the clearance of blanking [16].
Grain size has effect on the stability of the burnished surface length and fractured surface length. On the other hand, when micropiercing the material with smaller grain sizes, such as grain size of 1.0 μm and 1.5 μm, not only piercing force would increase but also piercing force becomes stable. In terms of stability of the sheared surface, selecting the grain size becomes important in micropiercing.
Finally, choice of grain size should be made by considering quality of parts, material characteristics, and process constancy, such as that for the sheared surface.
References
- Y. Saotome, J. JSTP. 49 (2008) 614–618. [Google Scholar]
- F. Vollertsen, D. Biermann, H.N. Hansen, I.S. Jawahir, K. Kuzman, CIRP Annals 86 (2009) 566–587. [Google Scholar]
- S.H. Wang (Ed.), Nanostructured metals and alloys, Woodhead Publishing Limited, Cambridge, 2011, pp. 747–786. [Google Scholar]
- T. Komatsu, T. Matsumura, S. Torizuka, Int. J. Autom. Tech. 5 (2011) 334–341. [Google Scholar]
- S. Torizuka, Materia Japan 45 (2006) 438–443. [CrossRef] [Google Scholar]
- T. Komatsu, H. Kobayashi, S. Torizuka, S. Nagayama, Int. J. Autom. Tech. 6 (2012) 802–806. [Google Scholar]
- H. Tomimura, S. Tanimoto, S. Takagi, J. Japan Inst. Metals 72 (1986) S505. [Google Scholar]
- S. Takagi, S. Tanimoto, H. Tomimura, J. Japan Inst. Metals 74 (1988) 1052–1057. [Google Scholar]
- M. Katoh, Y. Torisaka, J. Japan Inst. Met. Metals 80 (1988) 1052–1057. [Google Scholar]
- M. Katoh, Y. Torisaka, J. Japan Inst. Met. Metals 84 (1998) 127–130. [Google Scholar]
- Y. Omori, S. Torizuka, K. Nagai, J. Japan Inst. Met. Metals 89 (2003) 765–772. [Google Scholar]
- T. Komatsu, H. Kobayashi, S. Toriduka, S. Nagayama, The Proceedings of 4th Asian Work shop Nano/Micro Forming Technology 2011 (2011) 25–26. [Google Scholar]
- T. Suzuki, S. Nakano, T. Shiratori, M. Katoh, The Proceedings of the 2012 Japanese spring conference for the technology of plasticity (2012) 131–132. [Google Scholar]
- T. Komatsu, S. Toriduka, E. Muramatsu, S. Nagayama, H. Kobayashi, The Proceedings of the 2009 Japanese spring conference for the technology of plasticity (2009) 147–148. [Google Scholar]
- S. Toriduka, E. Muramatsu, T. Komatsu, S. Nagayama, The Proceedings of the 2009 Japanese spring conference for the technology of plasticity (2009) 143–144. [Google Scholar]
- J. Xu, B. Guo, C. Wang, D. Shan, Int. J. Mach. Tools manuf. 60 (2012) 27–34. [Google Scholar]
Cite this article as: Shiratori T, Suzuki Y, Nakano S, Yang M & Komatsu T: Effects of grain size on the sheared surface in micropiercing of austenitic stainless steel SUS304. Manufacturing Rev. 2015, 2, 9.
All Tables
All Figures
|
Figure 1. EBSD IPF map. (a) Gs1.0 μm, (b) Gs1.5 μm, (c) Gs3.0 μm, (d) Gs7.5 μm. |
| In the text | |
|
Figure 2. Experiment tools. (a) Desktop press unit, (b) micropiercing tool, (c) SEM image of punch, (d) SEM image of die. |
| In the text | |
|
Figure 3. Constitution of sheared surface. |
| In the text | |
|
Figure 4. SEM image of sheared surface. (a) Gs1.0 μm, (b) Gs1.5 μm, (c) Gs3.0 μm, (d) Gs7.5 μm. |
| In the text | |
|
Figure 5. Ratio of the sheared surface and standard deviation. (a) Ratio of the sheared surface, (b) standard deviation of the sheared surface (σ). |
| In the text | |
|
Figure 6. Inner diameter measuring result of “Gs3.0 μm” micropierced hole by UA3P-L. |
| In the text | |
|
Figure 7. Diameter of pierced hole. |
| In the text | |
|
Figure 8. Shearing diagrams at 1st shot of each materials. (a) Gs1.0 μm, (b) Gs1.5 μm, (c) Gs3.0 μm, (d) Gs7.5 μm. |
| In the text | |
|
Figure 9. Maximum piercing force and standard deviation. (a) Maximum piercing force, (b) standard deviation of maximum piercing force. |
| In the text | |
Current usage metrics show cumulative count of Article Views (full-text article views including HTML views, PDF and ePub downloads, according to the available data) and Abstracts Views on Vision4Press platform.
Data correspond to usage on the plateform after 2015. The current usage metrics is available 48-96 hours after online publication and is updated daily on week days.
Initial download of the metrics may take a while.