Open Access
Fig. 9
Download original image
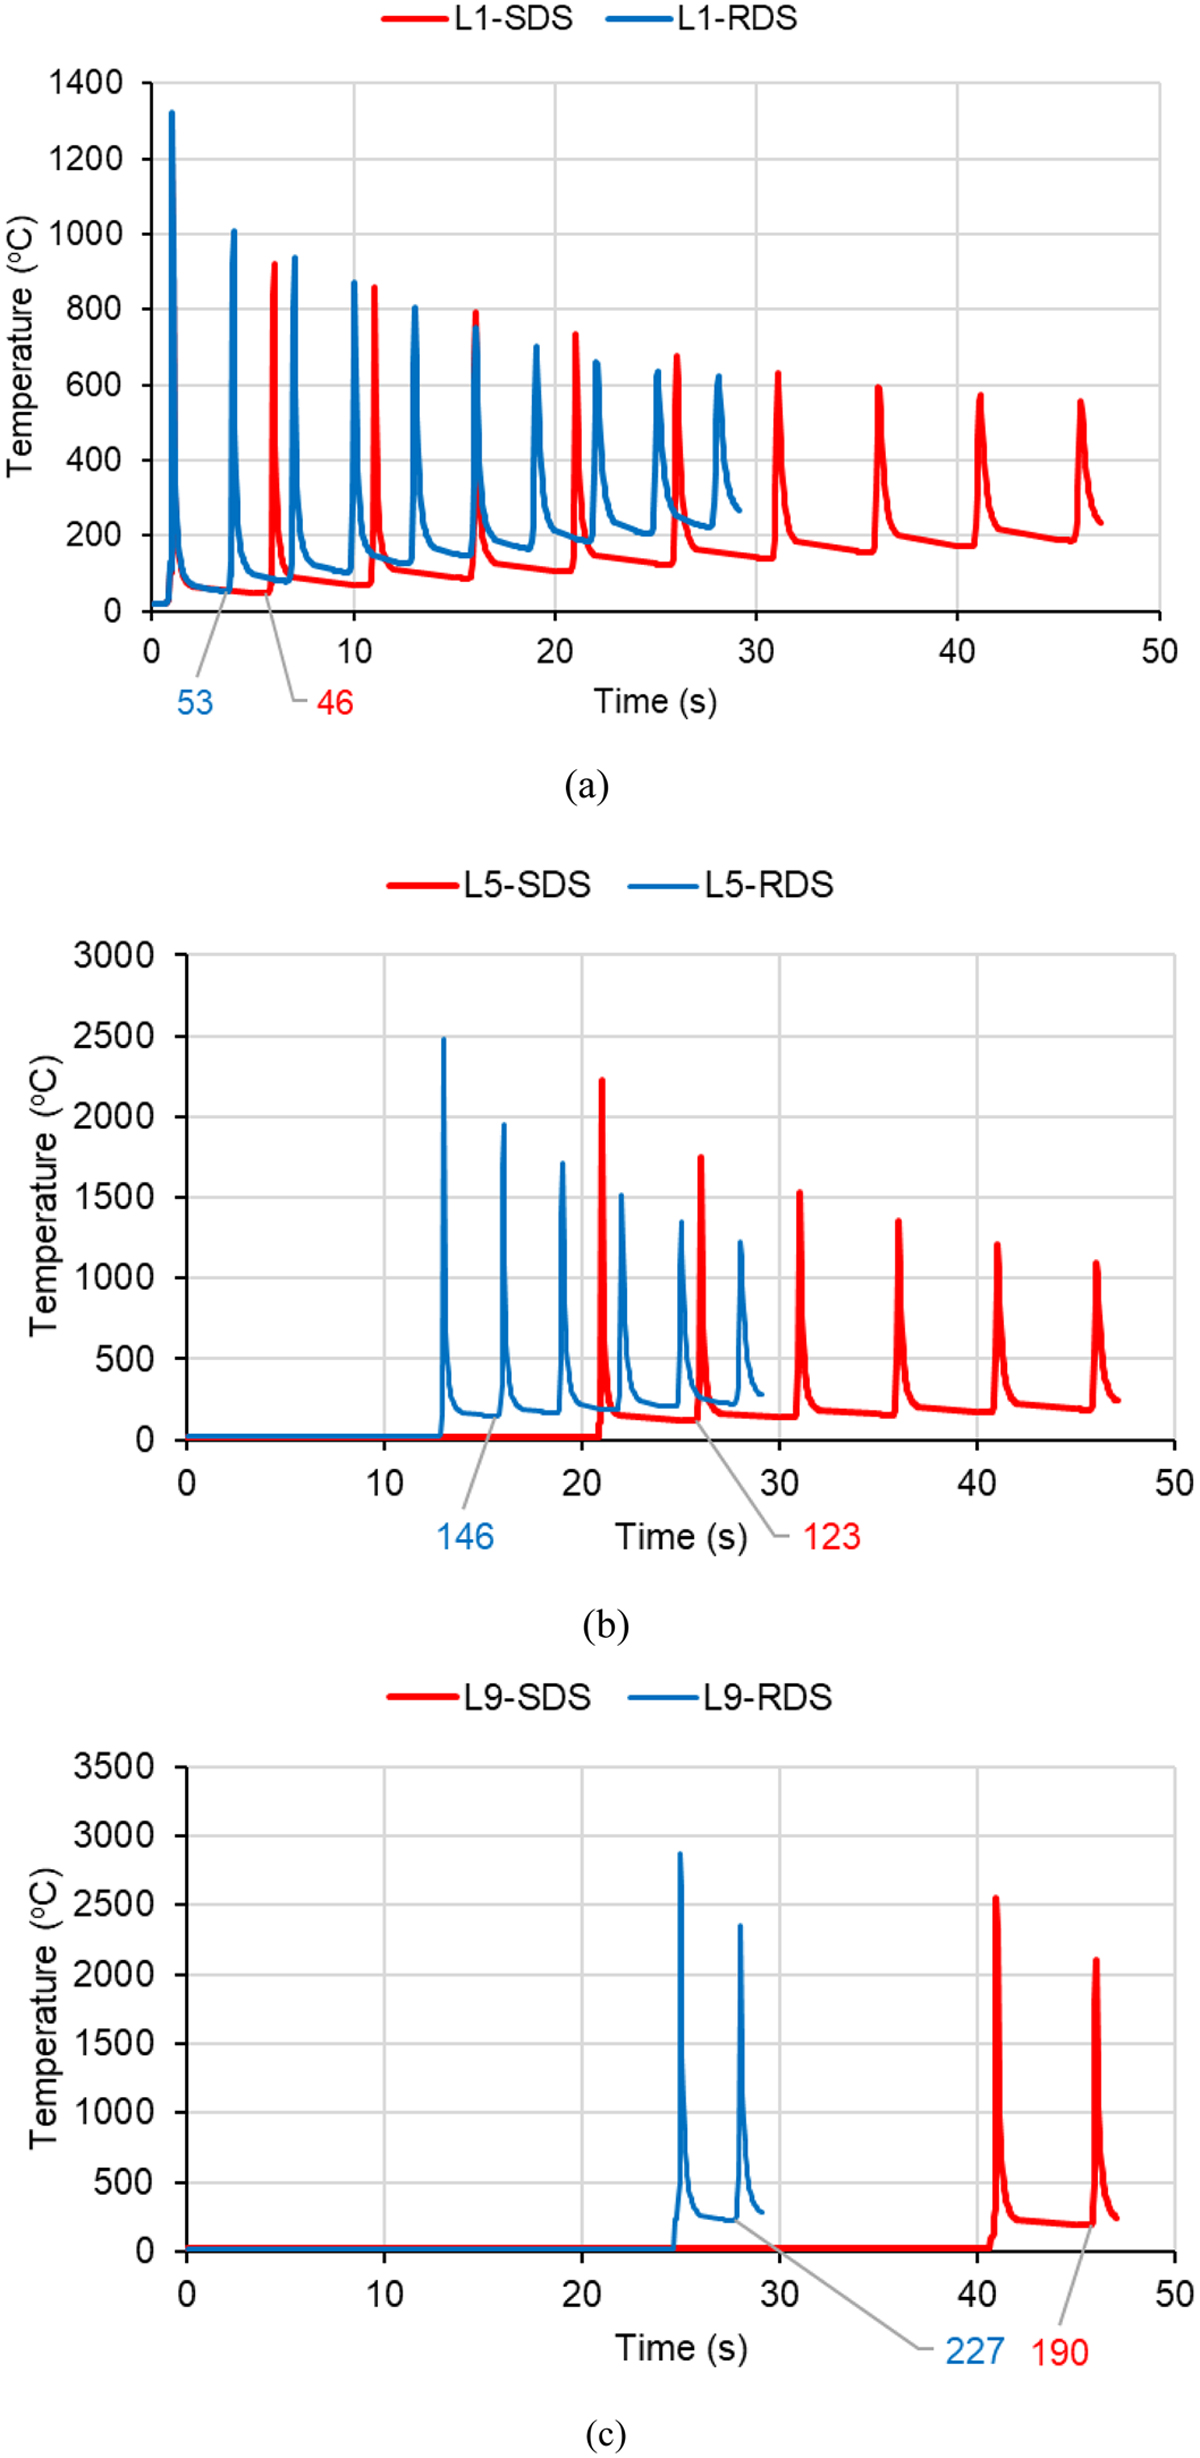
The comparison of the thermal cycles between the scanning methods (SDS and RDS) at the center point of (a) the first layer (L1), (b) the fifth layer (L5), and (c) the ninth layer (L9).
Current usage metrics show cumulative count of Article Views (full-text article views including HTML views, PDF and ePub downloads, according to the available data) and Abstracts Views on Vision4Press platform.
Data correspond to usage on the plateform after 2015. The current usage metrics is available 48-96 hours after online publication and is updated daily on week days.
Initial download of the metrics may take a while.