| Issue |
Manufacturing Rev.
Volume 11, 2024
|
|
|---|---|---|
| Article Number | 22 | |
| Number of page(s) | 10 | |
| DOI | https://doi.org/10.1051/mfreview/2024020 | |
| Published online | 05 November 2024 | |
Research article
Effect of laser beam energy density distribution on the main properties of laser additive forming of metal parts
Jilin Province Economic Management Cadre College, Changchun 130012, China
* e-mail: This email address is being protected from spambots. You need JavaScript enabled to view it.
Received:
6
May
2024
Accepted:
29
September
2024
Abstract
Compared to traditional processing techniques, laser additive manufacturing technology has advantages such as short processing cycles, no molds, and is not limited by complex structures. However, the forming quality of GH3625 nickel-base alloy metal parts is affected by various process parameters, in which the distribution characteristics of laser beam energy density, microstructure and mechanical properties play a key role. In order to investigate the influence of beam energy density distribution on the main properties of GH3625 nickel-based alloy metal parts, the beam energy density distribution was changed by controlling the defocusing amount. Then it sets 5 different defocusing parameters to obtain the corresponding energy density distribution characteristics. Observing and analyzing the various properties of alloy powder from the perspectives of different scanning speeds, laser power, and energy density distribution characteristics. The results show that when the laser power is 600 W, the scanning speed is 700 mm/min, and the energy density distribution is characteristic 4, the metal parts have the best performance. Its density is 99.90%, microhardness is 350.44 HV, tensile strength is 1328 Mpa, friction coefficient is about 0.51, and wear rate is 0.55%. This indicates that the laser additive forming method proposed in this study can effectively improve the hardness, density and other properties of GH3625 nickel-based alloy metal parts to achieve the best state, which provides an important reference for the further optimization of the material preparation process.
Key words: Laser additive manufacturing / defocusing amount / energy density distribution characteristics / mechanical properties / metal density
© J. Hu, Published by EDP Sciences 2024
 This is an Open Access article distributed under the terms of the Creative Commons Attribution License (https://creativecommons.org/licenses/by/4.0), which permits unrestricted use, distribution, and reproduction in any medium, provided the original work is properly cited.
1 Introduction
Laser additive manufacturing (LAM) is a technology that uses computer-aided CAD software to model and layer parts, and uses the method of material accumulation layer by layer to manufacture solid parts. Compared to traditional processing techniques, it has advantages such as short processing time, no mold, and is not limited by complex structures. LAM technology has broad application prospects in fields such as aerospace, automotive manufacturing, biomedicine, and national defense [1,2]. The energy density (EDE) characteristics of the laser beam (LB) used in LAM are usually Gaussian distribution, with a large temperature gradient (TGR), which has a significant impact on the growth of organizational grains and produces microscopic defects, reducing mechanical properties [3]. Improving the distribution characteristics (DCH) of laser EDE will directly affect the TGR, cooling rate, and solidification rate of the molten pool, which is meaningful to enhance the quality of laser additive processing [4]. However, currently, changes in the DCH of EDE are mainly achieved through beam shaping, which is difficult to achieve and the process is complex, with high costs [5]. Therefore, this study controls the distribution of beam EDE by controlling the defocusing amount, for exploring the impact of laser EDE DCH on the microstructure and properties of LAM alloys. The research is separated into four. The first is the literature review section, which summarizes the current research status of relevant technologies and fields both domestically and internationally, and analyzes the shortcomings of existing research. The second is the exploration of EDE distribution control methods, which proposes a method to control the defocus amount (DAM) on the ground of the characteristics of the LB to change the EDE DCH of the LB. The third is the experimental design part, which prepares for exploring the impact of beam EDE DCH on the main performance of metal parts. The fourth is the analysis of experimental results. By designing a series of comparative experiments, the final analysis results are obtained. The research aims to explore the impact of laser EDE distribution on LAM materials, and find more uniform EDE DCH of lasers to reduce adverse effects such as cracks and deformation caused by uneven EDE distribution in LAM.
2 Related works
The additive manufacturing of metal materials is usually divided into LAM, electron beam additive manufacturing, arc additive manufacturing, etc. according to their energy sources. LAM technology has broad application prospects in fields such as aerospace, automotive manufacturing, biomedicine, and national defense. Zhao and his team prepared Ti6AL4V alloy using static magnetic field direct energy deposition method, and then modulated the microstructure of the alloy using magnetic field assisted LAM method. The refined β grains and discontinuous α grain boundaries (GBs) significantly increase the tensile elongation [6]. Zhang and his team conducted a comparative research about the microstructure and corrosion resistance of AL7075 alloy from LAM and forging processes to improve the reliability and lifespan of lightweight components. The results indicate that compared with the samples prepared from forgings, the samples prepared with additives have a lower corrosion tendency and a higher corrosion rate [7]. Zhou and his team used finite element method to investigate the tribological properties of LAM gradient ag multilayer graphene/TC4 alloy self-lubricating composite material (GTMAC). The results indicate that GTMAC samples with smaller equivalent stresses can avoid material cracking and peeling [8]. Song and his team found that Ti64 material using laser powder bed melting (LPBF) had poor ductility. To improve the material's properties, they studied the effect of aluminum content on the material's strength. The results indicate that the higher the aluminum content, the gradually increased work hardening and uniform elongation of the material [9]. Li and his team proposed a new artificial intelligence assisted 3D material topology design method to fully utilize the advantages of voxel forming methods and establish a quantitative relationship between laser and process parameters. Numerical examples show that compared with classical optimization methods, this method can significantly improve the mechanical properties of macroscopic structures [10].
Usually, the EDE distribution of the LB emitted by a laser follows a Gaussian distribution, and in many laser technologies, there are different requirements for the EDE distribution of the LB. Therefore, in recent years, many scholars have conducted beam shaping research to change the DCH of LB EDE. Li and his team will achieve beamforming in wireless optical communication by incoherently stacking different orbital angular momentum (OAM) modes at different power ratios to obtain emission beams of different shapes with different power distributions. The results indicate that the beamforming scheme on the ground of OAM mode can significantly improve the effective coverage of traditional OWC systems [11]. Liu and his team designed a beam shaping system on the ground of a multichip two-dimensional green laser diode array with a fast axis collimator installed inside the light source to achieve a small size and high brightness fiber coupled laser module. This achieves the rearrangement of the beam on both axes, improving the beam quality [12]. Li and his team proposed a design framework for a beam shaping system with variable output beam size and specified irradiation profile, including the calculation and optimization process of the initial system, achieving high zoom ratio variable diameter beam shaping [13]. Chen and his team proposed a method for generating uniform flat top beams using a liquid crystal spatial light modulator (LC-SLM) to optimize the accuracy of ultra sensitive inertial measurement. It modulates a random incomplete Gaussian beam into a flat top beam by loading a beam shaping optimization algorithm on LC-SLM [14]. Chandran and his team achieved high-performance waveguide crossing on the ground of cosine cones using a beam shaping method for ultra compact waveguide intersections on a single silicon photonic platform. The results indicate that the insertion loss of the device is 0.197±0.017 dB at the designed central wavelength of 1310 nm. The measured response of the device is basically consistent with the results of three-dimensional time-domain finite difference simulation [15].
Through existing research, it can be found that the EDE characteristics of LB used in LAM are usually Gaussian distributions with large TGRs. This has a significant impact on the growth of organizational grains and is prone to micro defects, thereby reducing the mechanical properties of the material. Therefore, the control of beam EDE distribution and the impact of beam EDE distribution on the microstructure and mechanical properties of metal parts urgently need to be studied. In addition, the existing changes in energy density distribution characteristics are mainly achieved through beam shaping, which is difficult to achieve and the process is complex, and the cost is high. Therefore, research is conducted for controlling the beam density energy distribution (EDI) by controlling the defocusing amount, and to explore the impact of density DCH on the main properties of materials.
3 Control method of laser beam energy density distribution
When conducting laser additive forming manufacturing, the forming quality is influenced by various process parameters. In addition to general parameters, the focusing form of the laser beam, the shape and size of the spot, and the EDE distribution of the beam will have a significant impact on the quality of laser additive forming. Among them, the DCH of laser beam EDE can directly affect the TGR, cooling rate, and solidification rate of the molten pool. Therefore, studying the DCH of beam EDE and obtaining a simple and feasible control method to change the DCH of beam EDE is of great significance for controlling melt melting and improving the quality of laser additive processing. Generally speaking, the EDE of the LB emitted by the laser exhibits a Gaussian distribution in space, and the Gaussian laser beam can be expressed using the Kirchhoff formula, as shown in equation (1).
 (1)
(1)
In equation (1), A0 is the amplitude of the center light at the origin; k is the wave number; R(z) is the wavefront radius of a Gaussian beam on the beam waist. In the LAM process, the energy emitted by a laser beam on a unit area of the material is called EDE, and its calculation method is shown in equation (2).
 (2)
(2)
In equation (2), E is the energy density; P serves as the laser power (LP); D serves as the diameter of the light spot; v is the scanning speed. Gaussian beam is a relatively special type of Gaussian spherical wave [16,17]. The distribution of light field intensity in the propagation direction is shown in equation (3).
 (3)
(3)
In equation (3), C is the constant factor; ω0 is the waist spot radius of a Gaussian beam; ω(z) is the radius of the light spot on the equal phase plane along the propagation axis. The EDI of a Gaussian beam in the vertical propagation direction is shown in Equation (4).
 (4)
(4)
The commonly used laser beam in laser processing is a Gaussian beam. Although Gaussian beams are easy to obtain, their energy decreases from the center to the surroundings, resulting in a large TGR. Flat topped beams can obtain relatively uniform EDE DCH and markedly improve the excessive TGR [18–20]. Therefore, in some cases, it is necessary to transform Gaussian beams into flat topped beams with uniform EDI. The normalized EDE distribution of flat top laser and Gaussian laser is shown in Figure 1.
Figure 1 showcases that compared to the Gaussian laser EDI, the area with concentrated EDE distribution at the center position has significantly increased. The way to obtain a flat top laser requires changing the diameter of the beam spot, which affects the EDE distribution of the laser. Usually, the EDE DCH of a Gaussian laser can be effectively controlled by changing its beam order. However, this method requires the use of optical components to achieve beam shaping in actual production, and the operation is relatively complex. Therefore, this study considers changing the energy DCH of the beam trough transforming the DAM. The defocus amount includes two states: positive defocus amount and negative defocus amount, as shown in Figure 2.
Considering the characteristics of two defocusing amounts, and considering that the melting and solidification of metal powder during the LAM process are completed above the substrate, the laser energy during negative defocusing is mainly used for deep melting. This can cause damage to the formed part. Therefore, the study only discusses the positive defocusing amount. The change in defocusing actually affects the size of the laser spot on the workpiece, thereby affecting its EDE distribution. The conversion expression of spot diameter and defocus amount is shown in equation (5).
 (5)
(5)
In equation (5), X′ is the spot diameter of the laser beam on the workpiece; Z′ serves as the DAM; f serves as the focal length; D serves as the diameter of the incident LB. The change in defocusing amount can transform the convergence and divergence of the beam, thereby increasing or reducing the size of the laser spot. This study refers to the EDE distribution of each DAM as the EDE distribution feature, and when the defocus amount is 0 mm, it is called the EDE distribution feature 1. When the defocusing amounts are 2 mm, 4 mm, 6 mm, and 8 mm respectively, they are referred to as EDE DCH 2, 3, 4, and 5. The calculation method for the energy density distribution of laser under different defocusing amounts is shown in equation (6).
 (6)
(6)
In equation (6), Zr is the Rayleigh length; ω is the radius of the light spot; λ is the wavelength of the femtosecond laser; P is the LP. The EDE distribution characteristics of five different defocusing amounts are showcased in Table 1.
 |
Fig. 1 Normalized energy density distribution of Gaussian laser and flat top laser. |
 |
Fig. 2 Schematic diagram of two defocusing states. |
Distribution characteristics of laser energy density with different defocusing amounts.
4 Preparation method and scheme design of experimental materials
4.1 Experimental materials and equipment
The experiment used GH3625 nickel based alloy powder produced by a certain technology company, with a particle size range of 45–150 µm. This alloy contains 12 chemical components that can enhance the properties of the alloy. Ni and Cr elements can improve the corrosion resistance of the alloy, while Nb and Mo elements can strengthen the alloy and improve its durability. Ti element can reduce the poor Cr region in the grain boundary region. AL can improve weldability, Fe can strengthen solid solution and reduce costs, and C can improve the durability and creep properties of the alloy.
The LAM experiment was conducted using a LateCLAM-150V 3D printer, with a maximum power of 1000 W and a maximum forming size of 150 mm*100 mm. The equipment adopts a coaxial powder feeding laser head, and is equipped with an external powder feeder outside the equipment. In addition, the device is externally connected to a computer control system, which utilizes the control system to achieve five axis linkage of the laser head. Experiments were conducted on each EDE distribution feature using LP of 400 W, 600 W, 800 W, and scanning speeds of 600 mm/min, 700 mm/min, and 800 mm/min. In addition, the equipment used in the experiment includes a metallographic microscope Nikon MA100N, HSV-1000A digital micro Vickers hardness tester, electronic balance, universal tensile testing machine (UTMA-1000D), and friction and wear testing machine.
4.2 Experimental plan design
The first step is metallographic analysis and testing. Before observing and analyzing the microstructure, metallographic samples need to be prepared. The preparation process includes sampling, grinding, polishing, and corrosion. If the sample is too small, it needs to be embedded. This study first used the electric discharge wire cutting method to sample the sample, and then polished it from coarse to fine using sandpaper. The particle size of the sandpaper was 80 mesh, 200 mesh, 400 mesh, 800 mesh, 1000 mesh, 2000 mesh, and 3000 mesh. After grinding to a flat and smooth surface, a polishing experiment was conducted using polishing paste on a polishing machine to eliminate scratches caused by sandpaper polishing. Finally, the prepared sample was chemically corroded using an acidic corrosion solution of aqua regia. After the corrosion is completed, the metallographic surface is rinsed with clean water, and then a second rinse is carried out with anhydrous ethanol. After rinsing, it is dried using a dryer and observed under a metallographic microscope.
The study divides the mechanical performance analysis of metal parts into four main properties for testing, namely microhardness analysis, density analysis, tensile performance analysis, and friction and wear performance analysis. This study used wire cutting to obtain blocks of 15 mm*15 mm*4 mm. Before hardness measurement, the samples were gradually polished with 400 to 2000 grit sandpaper to ensure clear indentation can be observed during microhardness testing. The test applied a load of 500 g and maintained the load for 15 seconds, with 5 points taken from each sample for testing. When conducting density analysis, it is necessary to place the sample to be tested on an electronic balance, read and record the weight on the electronic balance display, and record it. Then it will place the beaker on the electronic balance, tie the sample to be tested with a thin rope, and immerse it in water to stabilize its suspension. At this time, read its weight. By measuring the buoyancy, the volume and density of the sample are calculated, and finally the density is obtained. The tensile performance analysis study uses the cutting method to cut tensile samples, and after cutting the tensile test samples, tensile tests are conducted. The tensile samples are shown in Figure 3.
When conducting friction and wear inspection analysis between formed metals, this study used pin disc friction, with a friction pin size of 4.6 mm*3.6 mm*16 mm. The parameter settings for the friction process include a wear time of 10 minutes, a load application of 100 N, a click frequency of 6.25 Hz, and a winding speed of 100 r/min. Before the start of the wear experiment, the friction pin and grinding disc were cleaned and dried, and the weight of the friction pin was measured to obtain the weight change. Meanwhile, the friction testing machine generated a test report.
 |
Fig. 3 Schematic diagram of stretching sample. |
5 Analysis of the impact of LB energy density distribution on the main performance of laser additive forming of metal parts
5.1 Macro morphology analysis of metal parts formed by laser additive forming
To compare the influences of different EDE DCH on the morphology of the sample, this study selected formed metal parts with a LP of 600 W for analysis. The results indicate that when the laser input power is constant, the EDE DCH can markedly affect the oxidation on the surface of the sample. As the EDE characteristic transforms from 1 to 4, the width of the melt channel of the sample gradually decreases, and the surface flatness changes. When the EDE characteristics are 1 and 2, the sample exhibits varying degrees of powder adhesion, which is due to the large TGR of the LB. The center of the molten pool absorbs (MPA) more energy, while the edge of the MPA less energy, resulting in pressure recoil. In addition, the sides of the sample are wavy, and when the EDE is divided into feature 4, the spacing between the ripples is roughly equal. This is because the laser EDI of feature 4 is more uniform, and the height difference of the molten pool is smaller.
5.2 Microstructure analysis of laser additive forming metal parts
To compare the influences of different EDE DCH about the microstructure of the sample, this study also selected microstructures with different parameters of 600 W and scanning speed of 700 mm/min for analysis. The results show that when the EDE characteristic transforms from 1 to 4, the grain growth conditions of the organization are good, so equiaxed grains are the main growth mode. But when the EDE distribution is characteristic 5, the heat input is insufficient, and the TGR becomes larger.
5.3 Density analysis of laser additive forming of metal parts
Pores, as the main macroscopic defects in the LAM process, affect the mechanical properties of formed parts and are one of the important evaluation indicators for the quality of formed parts. The number of internal pores in a material is usually measured by density, and the smaller the quantity of pores, the higher the density. In the process of LAM forming, if the process parameters are not properly selected, it is easy to cause more or less pore defects in the formed metal parts. Therefore, experimental studies were conducted to investigate the effects of LP, scanning speed, and laser EDE DCH on the density of LAM metal parts. The density changes of various energy density distribution characteristics under different laser frequencies and scanning speeds are shown in Figure 4.
Figure 4a demonstrates that as the LP grows from 400 W to 600 W, the energy input gradually increases, the temperature increases, and the density of the metal parts under the five characteristics gradually increases. As the LP is too high from 600 W to 800 W, it leads to excessive energy absorption by the metal powder, resulting in remelting of the alloy sample and the formation of internal defects, leading to a decrease in density. Figure 4b demonstrates that as the scanning speed increases from 600 mm/min to 700 mm/min, the density of the sample gradually increases. This is because the scanning speed affects the contact time between the LB and the metal powder. When the scanning speed exceeds 700 mm/min, the density begins to decrease. This is because the scanning speed is too fast, and the energy absorbed by the powder cannot completely melt, resulting in a decrease in density.
To further explore the impact of EDE distribution on density, the density of metal parts formed under different characteristics was tested, and the variation pattern is shown in Figure 5.
Figure 5 shows that under different LPs, the impact of EDE DCH on density shows the same trend. When the EDE DCH change from feature 1 to feature 4, the density of the sample increases. When the EDE distribution transforms from feature 5 to feature 5, the density decreases accordingly. When the laser density is 600 W, the density of the samples obtained from each EDE distribution feature is relatively high, and the highest density is 99.90% when the EDE distribution feature is 4.
 |
Fig. 4 Density distribution characteristics of various energy densities under different power and scanning speeds. |
 |
Fig. 5 Density changes of formed metal parts under various energy density distribution characteristics. |
5.4 Microhardness analysis of laser additive forming metal parts
The commonly used mechanical performance indicators include hardness, tensile strength (TST), friction and wear, etc. Good mechanical properties are important indicators for evaluating metal parts. A study was carried for measuring the hardness of the polished surface of alloy metal parts. A total of 5 measurement points were selected every 3 mm, and the average value after measurement is the hardness value. The microhardness of metals under different power and scanning speeds is shown in Figure 6.
Figure 6a showcases that when the LP is 600 W, the microhardness of the formed metal parts is the highest under each feature, with feature 4 having the highest hardness of 358.25 HV among all features. Figure 6b shows that at the EDE feature 4 and scanning speed of 700 mm/min, the maximum microhardness value measured for metal parts is 350.44 HV.
In addition, the study focuses on the DCH of EDE as the main analysis indicator to observe the changes in microhardness of formed metal parts under three different power levels; Its details are shown in Figure 7.
Figure 7 shows that during the process of changing the EDE distribution from feature 1 to feature 4, the microhardness of the metal parts gradually increases at each LP; When the EDE distribution transforms from feature 4 to feature 5, the microhardness decreases. On the ground of the content of Figure 7, it can be seen that at a LP of 600 W, feature 4 has the highest microhardness.
 |
Fig. 6 Microhardness of various laser powers and scanning speeds. |
 |
Fig. 7 Microhardness of different energy density distribution characteristics. |
5.5 Analysis of tensile properties of laser additive forming metal parts
The commonly used method for evaluating material strength is to conduct tensile testing on it, and tensile strength and elongation can determine the quality of material properties. The experiment involves cutting samples in both parallel and vertical scanning directions (VSD) to perform polar tensile tests. The variation curve of TST with energy density DCH of LAM alloy samples is shown in Figure 8.
Figure 8a shows that in the parallel scanning direction, when the EDE distribution transforms from feature 1 to feature 4, the tensile strength gradually increases; When changing from feature 4 to feature 5, the tensile strength decreases. When the LP is 600 W, the maximum TST of EDE distribution feature 4 is 1328 Mpa. Figure 8b showcases that the variation pattern of TST in the VSD is in line with that in the parallel direction. The maximum value is 1268 Mpa.
To further verify the strength of metal components under different EDE distributions, the study plotted characteristic force displacement curves under five different characteristics, as shown in Figure 9.
As shown in Figure 9, the higher the tensile strength, the smaller the elongation. The elongation of feature 1 is 15.06%, feature 2 is 12.64%, feature 3 is 11.57%, feature 4 is 10.22%, and feature 5 is 11.83%.
 |
Fig. 8 TST of various energy density distribution characteristics. |
 |
Fig. 9 Force displacement curves of different energy density distribution characteristics. |
5.6 Analysis of friction and wear properties of laser additive forming metal parts
Wear resistance is another very important characteristic in material properties, and the two main indicators reflecting material friction and wear performance are friction coefficient and wear rate. This summary conducts friction and wear tests on LAM alloy samples, analyzing the effects of different LP, scanning speed, and EDE DCH on their friction performance. The changes in friction performance of metal parts under different LP and scanning speeds are showcased in Figure 10.
Figure 10a shows that under different LP, after applying a load, the friction coefficient rapidly increases and fluctuates back and forth as the experiment progresses, starting to fluctuate steadily around 50 seconds. As the power is 600 W, the friction coefficient is the lowest, and when the power is 400 W, the friction coefficient is the highest. As the LP is 600 W, the wear rate is also the smallest, at 0.55%. Figure 10b shows that when the scanning speed is 700 mm/min, the minimum wear rate of the metal parts is 0.52%, and the friction coefficient is also the highest.
To further explore the impact of EDE DCH on friction and wear performance, this study observed the changes in the relation in friction coefficient and time for different characteristics, as well as the changes in wear rate, as shown in Figure 11. The scanning speed for this experiment is set to 700 mm/min.
As shown in Figure 11, as the EDE distribution transforms from feature 1 to feature 4, the friction coefficient gradually decreases and the wear rate decreases; As the EDE distribution is characteristic 5, the friction coefficient increases and the wear rate increases. When the LP is 600 W, the scanning speed is 700 mm/min, and the EDE distribution feature is 4, the friction coefficient and wear rate are both the smallest, with a friction coefficient of about 0.51 and a wear rate of 0.55%.
 |
Fig. 10 Friction and wear performance under different power and scanning speeds. |
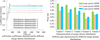 |
Fig. 11 Friction coefficient and wear rate of different features. |
6 Conclusion
To explore the impact of laser EDE distribution on metal parts, a study was conducted to control the DCH of laser EDE by changing the defocusing amount. A series of experiments were conducted on GH3625 alloy powder. The macroscopic morphology, microstructure, density, hardness, tensile and friction wear properties of LAM metal samples were analyzed from three aspects: LP, scanning speed, and energy density distribution characteristics. The conclusion drawn from the analysis of the results is that changes in defocusing amount can bring about changes in the EDE DCH. Low LP or excessive scanning speed can lead to insufficient energy absorption of metal powder, resulting in insufficient melting of metal powder and uneven forming surface. Excessive LP or low scanning speed can lead to severe oxidation of the formed surface. When the EDE distribution transforms from feature 1 to feature 4, the EDE distribution gradually is uniform and the forming quality is better. When the power is 600 W and the scanning speed is 700 mm/min, the forming material with feature 4 has the best performance among all features. Its density is 99.90%, the maximum microhardness measured is 350.44 HV, the tensile strength is 1328 Mpa, the friction coefficient is about 0.51, and the wear rate is 0.55%. When the EDE distribution is characteristic 5, as the EDE distribution is uniform, the EDE is small and the forming quality is still not ideal. Aerospace structural components usually work in high-temperature environments, and in the subsequent research process, further exploration of material mechanical properties in high-temperature environments can be considered.
Funding
This research received no external funding.
Conflicts of interest
The authors declare no conflict of interest.
Data availability statement
All data generated or analysed during this study are included in this published article.
Author contribution statement
In order to explore the influence of laser EDE distribution on metal parts, the DCH of laser EDE was controlled by changing the defocus amount. J. Hu conducted a series of experiments on GH3625 alloy powder. The macroscopic morphology, microstructure, density, hardness, tensile and frictional wear properties of LAM metal samples were analyzed from three aspects: LP, scanning speed, and energy density distribution characteristics. J. Hu is an independent author who has made full contributions to this study without any conflicts of interest.
References
- S.A. Tyagi M. Manjaiah, Laser additive manufacturing of titanium-based functionally graded materials: a review, J. Mater. Eng. Perform. 31 (2022) 6131–6148 [CrossRef] [Google Scholar]
- Z. Zhou, S. Li, X. Gao, Numerical modeling of thermal behavior of melt pool in laser additive manufacturing of Ni-based diamond tools, Ceram. Int. 48 (2022) 14876–14890 [CrossRef] [Google Scholar]
- N.A. Charoo, S.F. Barakh Ali, E.M. Mohamed, M.A. Kuttolamadom, T. Ozkan, M.A. Khan, Z. Rahman, Selective laser sintering 3D printing - an overview of the technology and pharmaceutical applications, Drug Dev. Ind. Pharmacy 46 (2020) 869–877 [CrossRef] [Google Scholar]
- J. Bayol, Development of an MPLC-based laser head: advances in beam shaping applied to laser beam welding, PhotonicsViews 18 (2021) 54–58 [CrossRef] [Google Scholar]
- S.L. Sing, W.Y. Yeong, Laser powder bed fusion for metal additive manufacturing: perspectives on recent developments, Virtual Phys. Prototyp. 15 (2020) 359–370 [CrossRef] [Google Scholar]
- R. Zhao, C. Chen, S. Shuai, T. Hu, Y. Fautrelle, H. Liao, J. Lu, J. Wang, Z. Ren, Enhanced mechanical properties of Ti6Al4V alloy fabricated by laser additive manufacturing under static magnetic field, Mater. Res. Lett. 10 (2022) 530–538 [CrossRef] [Google Scholar]
- J. Zhang, J. Ye, B. Song, R.D. Li, Y.S. Shi, Comparative study on microstructure and electrochemical corrosion resistance of Al7075 alloy prepared by laser additive manufacturing and forging technology, J. Central South Univ. 28 (2021) 1058–1067 [CrossRef] [Google Scholar]
- H. Zhou, C. Wu, D. Tang, X. Shi, Y. Xue, Q. Huang, J. Zhang, A.H. Elsheikh, A.M.M. Lbrahim, Tribological performance of gradient Ag-multilayer graphene/TC4 alloy self-lubricating composites prepared by laser additive manufacturing, Tribol. Trans. 64 (2021) 819–829 [CrossRef] [Google Scholar]
- Z. Song, X. Zeng, L. Wang, Laser additive manufacturing of titanium alloys with various Al contents, Mater. Res. Lett. 11 (2023) 391–398 [CrossRef] [Google Scholar]
- S.Y. Li, H.K. Wei, S.Q. Yuan, J.H. Zhu, J. Li, W.H. Zhang, Collaborative optimization design of process parameter and structural topology for laser additive manufacturing, Chin. J. Aeronaut. 36 (2023) 456–467 [CrossRef] [Google Scholar]
- J. Li, Q. Yang, X. Dai, C. Lim, A. Nirmalathas, Investigation on orbital angular momentum mode-based beam shaping for indoor optical wireless communications, J. Lightwave Technol. 40 (2022) 7738–7745 [CrossRef] [Google Scholar]
- Z. Liu, W. Qin, Q. Li, Y. Liu, M. Jiang, Y. Cao, Z. Wang, Design of high-brightness, fiber-coupled, beam shaping system based on a multichip 2D green laser diode array, Opt. Eng. 61 (2022) 126104 [Google Scholar]
- W. Li, S. Wei, Z. Fan, Z. Zhu, D. Ma, Variable-diameter beam-shaping system design with high zoom ratio containing aspheric optical components, Appl. Optics 60 (2021) 705–713 [CrossRef] [Google Scholar]
- X. Chen, X. Fang, D. Ma, Y. Liu, L. Cao, Y. Zhai, Optimization of beam shaping for ultrasensitive inertial measurement using a phase-only spatial light modulator, Appl. Optics 61 (2022) 55–64 [Google Scholar]
- S. Chandran, M. Dahlem, Y. Bian, P. Moreira, A.P. Jacob, M. Rakowski, J. Viegas, Beam shaping for ultra-compact waveguide crossings on monolithic silicon photonics platform, Opt. Lett. 45 (2020) 6230–6233 [CrossRef] [Google Scholar]
- G. Piscopo, L. Iuliano, Current research and industrial application of laser powder directed energy deposition, Int. J. Adv. Manufactur. Technol. 119 (2022) 6893–6917 [CrossRef] [Google Scholar]
- H.Z. Yu, R.S. Mishra, Additive friction stir deposition: a deformation processing route to metal additive manufacturing, Mater. Res. Lett. 9 (2021) 71–83 [CrossRef] [Google Scholar]
- M.Á. Caminero, A. Romero, J.M. Chacón, P.J. Núñez, E. García-Plaza, G.P. Rodríguez, Additive manufacturing of 316L stainless-steel structures using fused filament fabrication technology: mechanical and geometric properties, Rapid Prototyp. J. 27 (2021) 583–591 [CrossRef] [Google Scholar]
- R. Khan, K. Ullah, D. Pamucar, M. Bari, Performance measure using a multi-attribute decision-making approach based on complex t-spherical fuzzy power aggregation operators, J. Comput. Cogn. Eng. 1 (2022) 138–146 [Google Scholar]
- A.S. Maihulla, I. Yusuf, S.I. Bala, Reliability and performance analysis of a series-parallel system using Gumbel-Hougaard family copula, J. Comput. Cogn. Eng. 1 (2022) 74–82 [Google Scholar]
Cite this article as: Jing Hu, Effect of laser beam energy density distribution on the main properties of laser additive forming of metal parts, Manufacturing Rev. 11, 22 (2024), https://doi.org/10.1051/mfreview/2024020
All Tables
Distribution characteristics of laser energy density with different defocusing amounts.
All Figures
|
Fig. 1 Normalized energy density distribution of Gaussian laser and flat top laser. |
| In the text | |
|
Fig. 2 Schematic diagram of two defocusing states. |
| In the text | |
|
Fig. 3 Schematic diagram of stretching sample. |
| In the text | |
|
Fig. 4 Density distribution characteristics of various energy densities under different power and scanning speeds. |
| In the text | |
|
Fig. 5 Density changes of formed metal parts under various energy density distribution characteristics. |
| In the text | |
|
Fig. 6 Microhardness of various laser powers and scanning speeds. |
| In the text | |
|
Fig. 7 Microhardness of different energy density distribution characteristics. |
| In the text | |
|
Fig. 8 TST of various energy density distribution characteristics. |
| In the text | |
|
Fig. 9 Force displacement curves of different energy density distribution characteristics. |
| In the text | |
|
Fig. 10 Friction and wear performance under different power and scanning speeds. |
| In the text | |
|
Fig. 11 Friction coefficient and wear rate of different features. |
| In the text | |
Current usage metrics show cumulative count of Article Views (full-text article views including HTML views, PDF and ePub downloads, according to the available data) and Abstracts Views on Vision4Press platform.
Data correspond to usage on the plateform after 2015. The current usage metrics is available 48-96 hours after online publication and is updated daily on week days.
Initial download of the metrics may take a while.