Fig. 12
Download original image
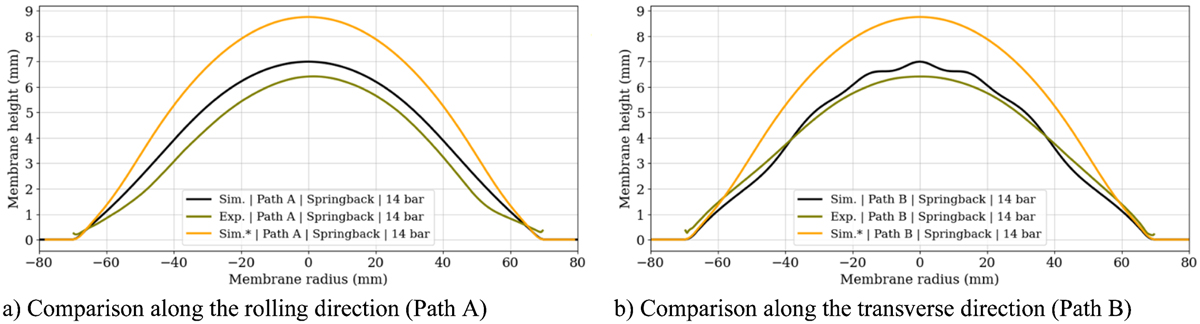
Validation of the FE model in comparison to the experimental geometry measurements: The cross-sectional profiles of the membrane after hydroforming and springback are compared. The plots show the results along the rolling direction (a) and the transverse direction (b). The anisotropic simulation (“Sim.”, black line) shows an improved prediction of the geometry in relation to the experimental data (“Exp.”, green line) in comparison with the simplified isotropic model (“Sim.*”, orange line).
Current usage metrics show cumulative count of Article Views (full-text article views including HTML views, PDF and ePub downloads, according to the available data) and Abstracts Views on Vision4Press platform.
Data correspond to usage on the plateform after 2015. The current usage metrics is available 48-96 hours after online publication and is updated daily on week days.
Initial download of the metrics may take a while.