| Issue |
Manufacturing Rev.
Volume 5, 2018
|
|
|---|---|---|
| Article Number | 5 | |
| Number of page(s) | 12 | |
| DOI | https://doi.org/10.1051/mfreview/2018002 | |
| Published online | 01 June 2018 | |
Research Article
Prediction of surface roughness and cutting force under MQL turning of AISI 4340 with nano fluid by using response surface methodology
1
Bharati Vidyapeeth College of Engineering,
Kolhapur
416004,
M.S, India
2
Department of Mechanical Engineering, Sanjay Ghodawat Group of Institutions, College of Engineering,
Atigre M.S,
Kolhapur, India
* e-mail: This email address is being protected from spambots. You need JavaScript enabled to view it.
Received:
30
October
2017
Accepted:
18
January
2018
Abstract
This paper presents an investigation into the minimum quantity lubrication mode with nano fluid during turning of alloy steel AISI 4340 work piece material with the objective of experimental model in order to predict surface roughness and cutting force and analyze effect of process parameters on machinability. Full factorial design matrix was used for experimental plan. According to design of experiment surface roughness and cutting force were measured. The relationship between the response variables and the process parameters is determined through the response surface methodology, using a quadratic regression model. Results show how much surface roughness is mainly influenced by feed rate and cutting speed. The depth of cut exhibits maximum influence on cutting force components as compared to the feed rate and cutting speed. The values predicted from the model and experimental values are very close to each other.
Key words: MQL / nano fluid / surface roughness / cutting force / RSM
© P.B. Patole and V.V. Kulkarni, Published by EDP Sciences 2018
 This is an Open Access article distributed under the terms of the Creative Commons Attribution License (http://creativecommons.org/licenses/by/4.0), which permits unrestricted use, distribution, and reproduction in any medium, provided the original work is properly cited.
1 Introduction
Nowadays machining plays a significant role in the manufacturing industry. Manufacturing process in which the desired shape, size and surface finish are achieved through the removal of excess materials in the form of small chips [1]. The relative motion between cutting tool and work piece during machining causes extensive plastic deformation. During such plastic deformation, almost 99% of the energy fed to the machine tool is converted into heat. When ferrous and other high strength materials are machined, the temperature rises with the speed and the tool strength decreases, leading to faster wear and tool failure [2]. The heat produced needs to be cooled down constantly around the cutting zone so that the work piece and cutting tool can be kept under controlled temperature. The overheating of the cutting tool may reduce its sharpness. The use of a blunt tool results in excessive power consumption and poor surface finish [3]. It also impairs the surface integrity of the product by inducing tensile residual stresses and surface and subsurface micro cracks in addition to rapid oxidation and corrosion [4]. However, in high speed machining the conventional cutting fluid application fails to carry away the heat effectively [5]. Therefore, the recent development of nano fluids provides alterative cutting fluids which can be used in minimum quantity lubrication (MQL) machining [6]. The tribological and advanced heat transfer properties of nano fluids can provide better lubricating and cooling in the MQL machining process, and make it production-feasible. With proper selection of the cutting parameters and the MQL system, it is possible for MQL machining with minimum cost and less quantity of coolant to obtain better conditions, in terms of lubricity, tool life, cutting temperature, surface finish and optimization of cutting parameters [7]. To improve the surface characteristics from micro level to nano level, nano fluids are useful in the machining process [8].
It is observed that considerable research has taken place to study the effect of cutting parameters, different cooling systems using conventional cutting fluids in machining processes and on the work piece properties. Though there is a lot of work done on the effect of MQL technique. Very little or no work is reported on the use of MQL with nano fluid in turning of alloy steel AISI 4340 (which is used in Crank case, Junction boxes, Gear boxes, heavy shafts, spindles, couplings, pins, etc.) by using response surface methodology (RSM). Therefore the present paper describes the development of predictive model for surface roughness and cutting force in MQL turning of AISI 4340 with nano fluid. The model is formulated in terms of cutting conditions namely cutting speed, feed, depth of cut and tool nose radius. Full factorial design matrix is used for plan of experiments and analysis is performed using RSM.
2 Literature review
Many researchers have reported research works on effects of cutting parameter on surface roughness, different cooling systems with conventional cutting fluids in machining processes. The aim of the present work is to study the effect of MQL with nano fluids in machining process.
Klocke and Eisenblatter [9], demonstrated the interest of dry machining and met the success in the field of manufacturing. However, these can be sometimes less effective when higher machining efficiency, better surface finish quality and several machining conditions are required. In these circumstances very small amount of cutting fluids are expected to become a powerful tool. They play a significant role in MQL, refers use of small quantity of cutting fluids at a flow rate of 50–500 mL/h.
Sardiñas et al. [10], presented a multi-objective optimization technique, based on genetic algorithms, to optimize the cutting parameters in turning processes: cutting depth, feed and speed. Two conflicting objectives, tool life and operation time, are simultaneously optimized. The proposed model uses a micro genetic algorithm in order to obtain the non-dominated points and build the Pareto front graph. This paper also remarks the advantages of multi-objective optimization approach over the single-objective one.
Dhar et al. [18], have carried out experimental investigation into the roles of MQL on tool wear and surface roughness in turning AISI 4340 steel at industrial speed-feed combinations with an uncoated carbide insert, with constant process parameters and MQL supply. The authors found that the results include significant reduction in the tool wear-rate and surface roughness by the MQL, mainly through the reduction in the cutting zone temperature and a favourable change in the chip–tool and work–tool interaction. However, in the present investigations with the tool, working material and the machining conditions undertaken, the tool failure mode has been mostly gradual wear. Tool wear initially started with a relatively faster rate due to what is called break-in wear caused by attrition and micro chipping at the sharp cutting edges. Some plastic deformation and micro chipping were found to occur under dry and wet machining conditions. Severe groove wear and notch wear at the flank surfaces were found in the insert under both dry and wet conditions.
Singh and Rao [11], have done an experimental investigation to determine the effects of cutting conditions and tool geometry on the surface roughness in the finish hard turning of the bearing steel (AISI 52100). This study shows that the feed is the dominant factor determining the surface finish followed by nose radius and cutting velocity. Though, the effect of the effective rake angle on the surface finish is less, the interaction effects of nose radius and effective rake angle are considerably significant. Mathematical models for the surface roughness were developed by using the RSM.
Hwang and Lee [12], have studied an investigation into the MQL and wet turning processes of AISI 1045 work material with the objective of suggesting the experimental model in order to predict the cutting force and surface roughness, to select the optimal cutting parameters, and to analyze the effects of cutting parameters on machinability. From the experimental results and regression analysis, this research project suggested the experimental equations, proposed the optimal cutting parameters, and analyzed the effects of cutting parameters on surface roughness and cutting force in the MQL and wet turning processes.
Venkatesan et al. [13], have presented the results of experimental investigation on machinability properties of Silicon Carbide and Boron Carbide reinforced Aluminum 356 hybrid metal matrix composite. Face centered central composite experimental design coupled with RSM was used for modeling. RSM showed an accuracy of 95%. Moreover, a good agreement was observed between the experimental and the predicted values of surface roughness and cutting force.
Khidhir et al. [14], developed a predictive model for surface roughness and temperature in turning operation of AISI 1020 mild steel using cemented carbide in a dry condition using the response surface method (RSM). The analysis of variance (ANOVA) for the predictive model of second order for both models shows that the feed rate is the most significant parameter which affects the surface roughness and temperature followed by cutting speed. Both models are convenient for predicting of the main effects of the machining parameters and are economical for determining the influence of various parameters in a systematic manner.
Tim Walker [15], described MQL uses a very small amount of a fluid to reduce the friction between a cutting tool and the work piece. The exact amount for “minimum” varies depending on who you ask. The German DIN specification puts it up to 50 mL/h of lubricant and, in exceptional cases, up to 150 mL/h. Other studies have put the cap at 500 mL/h.
Tomov et al. [16], have derived mathematical models were verified using two different Computer Numerical Control (CNC) lathes, working pieces made of the material 42CrMo(EN), using finishing inserts. Also the paper provides the theoretically calculated values, the measured values and the percentage differences between them for the considered R-parameters. The paper propose algorithm of steps for predicting and realizing the considered roughness parameters for industrial purposes.
It was observed that there is no study reported in the literature which is aimed at to predict surface roughness and cutting force under MQL turning of AISI 4340 by using nano cooling fluid. Table 1 shows research summery of cutting fluid, work piece material, air fluid pressure and flow rate.
Research summary.
3 Experimental procedure
The design of experiment has a major effect on the number of experiments required. In this research work full factorial design matrix was selected. In this study, the four process parameters namely speed, feed, depth of cut, tool nose radius and two response variables namely surface roughness, cutting force were selected for the experimentation. The range of each parameter was fixed at different levels shown in Table 2.
Based on full factorial design (51 * 31 * 22), a total of 60 experiments were carried out on high precession MAXTURN++ (MTAB) CNC lathe machine (Speed 50–6000 rpm, motor 7 KW). In order to perform the experiment in MQL cutting environment ethylene glycol as a base fluid with Multiwalled carbon nano tube (MWCNT) nano particles has been used as a cutting fluid. The cutting fluid is prepared with mixture of ethylene glycol and the MWCNT in the concentration of 0.2% [27]. According to supplying direction and distance of the cutting fluid, in this experiment the distance between nozzle and insert tip was fixed at 11 mm and cutting fluid were supplied at a 30° angle [26]. The general purpose of MWCNT is improvement in cutting performance because it is having higher heat carrying capacity which improves cooling effect and results in better surface finish [7]. During the experimentation MQL system supplied ethylene with nano particle at pressure 5 bar and flow rate140 mL/h [27].
The work piece material used is a cylindrical bar of AISI 4340 having BHN 217, 100 mm length and 24 mm diameter Figure 1 shows schematic diagram of experimental set up. This material is used for gears, shafts, couplings and other parts. The cutting insert used for the experimental work is tungsten carbide coated with specification CCMT-090308. The surface roughness of the turned work piece was measured with Mitutoyo make surface roughness tester (SJ-201P) with 0.8 mm cut-off value. All measurements were repeated three times and the average value was taken as the final value. The cutting forces measured with the help of Kistler Dynamometer, a charge amplifier and PC software [28].
Factors and levels.
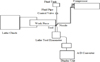 |
Fig. 1 Schematic diagram of experimental set up. |
4 Methodology
The methodology is a representation of the sequence of the activities in this research work. The first step is literature review on related areas. Arranging the equipment’s for initiating the experiment will be the next step. MQL Machining trials with nano fluid on CNC lathe are conducted; further readings and all the data from the experiments will be collected. The final step is analysis, comparison between results obtained with predicted results, mathematical modeling and validation of experiment.
4.1 Cutting process model
The cutting process model is formulated in terms of cutting conditions namely cutting speed, feed, depth of cut and tool nose radius. Full factorial design matrix is used for plan of experiments and analysis is performed using RSM.
4.1.1 Decision variables
In this research work problem four decision variables are considered: cutting speed (v), feed rate (f), depth of cut (h), and tool nose radius (r). These are the process parameters of the MQL turning process with nano fluid.
4.1.2 Objective function
The objective is prediction of surface roughness and cutting force under MQL turning mode with nano fluid.
4.1.3 Constrains
There are some controllable parameters which affect response parameter as well as optimal cutting conditions and will be taken into account. According to tool manufacturer’s catalogue the values of variables are restricted from bottom and top within permissible limits.
 (1)
(1)
 (2)
(2)
 (3)
(3)
 (4)
(4)
4.2 Response surface methodology
The following relationship is commonly used for representing the mathematical models:
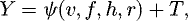 (5)
where Y is turning response, ᴪ is the response function and v, f, h, r are the cutting speed, feed, depth of cut and tool nose radius and ᶓ is the error which is normally distributed with zero mean according to the observed response. In order to investigate the influence of machining parameters on the surface roughness (Ra) and cutting force (Fz) four principal machining parameters such as cutting speed, feed rate, depth of cut and tool nose radius were taken. In this research study, these machining parameters were chosen as the independent input variables. The desired response was the surface roughness (Ra) and cutting force (Fz) which is assumed to be affected by the above four principal machining parameters. The RSM was employed for modeling and analyzing the machining parameters in the MQL turning of AISI 4340 with nano fluid process so as to obtain the machinability performances of Ra and Fz. RSM is an approach to find out the relationship between different cutting parameters and analyze the effect on response parameters such as surface roughness and cutting force. In the RSM, the quantitative form of relationship between the desired response and independent input variables is represented as follows:
(5)
where Y is turning response, ᴪ is the response function and v, f, h, r are the cutting speed, feed, depth of cut and tool nose radius and ᶓ is the error which is normally distributed with zero mean according to the observed response. In order to investigate the influence of machining parameters on the surface roughness (Ra) and cutting force (Fz) four principal machining parameters such as cutting speed, feed rate, depth of cut and tool nose radius were taken. In this research study, these machining parameters were chosen as the independent input variables. The desired response was the surface roughness (Ra) and cutting force (Fz) which is assumed to be affected by the above four principal machining parameters. The RSM was employed for modeling and analyzing the machining parameters in the MQL turning of AISI 4340 with nano fluid process so as to obtain the machinability performances of Ra and Fz. RSM is an approach to find out the relationship between different cutting parameters and analyze the effect on response parameters such as surface roughness and cutting force. In the RSM, the quantitative form of relationship between the desired response and independent input variables is represented as follows:
 (6)where Y is response; xi (1,2,…k) is the coded level of k variables and b0 is the constant term, where bi, bii and bij are the coefficients of the linear equation. The non-linear equation (6) is converted into linear through logarithmic transformation. MINITAB software was used to determine the coefficients of mathematical modeling based on response. The estimated response is obtained from the generalized regression equation (6) as given in equation (7). The general second order model is given below:
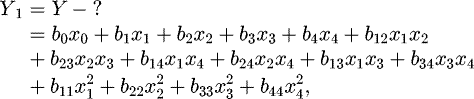 (7)where Y2 is the estimated response based on second order equation. The parameters b0, b1, b2, b3, b4, b12, b23, b14, are to be estimated by the method of lest squares. The coded values of variables to be used in equation (7) were obtained from the following transforming equations:
 (8)
(8)
 (9)
(9)
 (10)
(10)
 (11)where x1 is the coded value of cutting speed (v), x2 is the coded value of feed (f), x3 is the coded value of depth of cut (h), x4 is the coded value of too nose radius (r).
5 Results and discussion
The data obtained from various experiments is used for statistical analysis and build up a mathematical model to predict surface roughness and cutting force as follows.
5.1 Formulation of the mathematical model
The statistical analysis of data carried out in two steps: firstly ANOVA to study the contribution of the process parameters and secondly development of models for surface roughness and cutting force under MQL turning mode with nano fluid. RSM was used to quantify relationship between measured response factor and input parameters. The mathematical model relationship obtained for analyzing the influences of the different cutting parameters on the surface roughness and cutting force is in the following form.
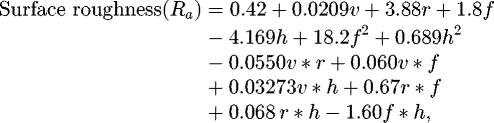 (12)
(12)
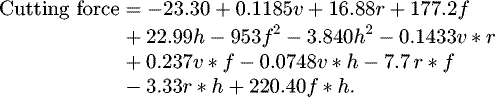 (13)
(13)
Table 3 shows model summary of surface roughness and cutting force. The quantity R2 called as coefficient of determination is used to judge the adequacy of model developed. The higher of R2 indicates the better fitting of the model with the data [29]. In this model the adjusted R2 value is nearly closer to the predicted R2. From analysis it is seen that the cutting force equation is more appropriate as compared to surface roughness equation for accurate prediction. Also it is observed that higher R2 value is obtained in case of cutting force as compared to surface roughness.
Model summary.
5.2 Analysis of mathematical model
The second order polynomial models were developed for surface roughness and cutting force. Maximum R2 value indicates the fitness of the model. R2 value of cutting force is 99.75% which indicates that the developed regression model is adequately significant at 95% confidence limit where as surface roughness R2 value is 85.17%. Also in this model adjusted R2 value is very closer to the predicted R2 value. To test the statistical significance of model, ANOVA table is constructed for surface roughness and cutting force and shown in Tables 4 and 5. F-ratio is also the important factor to check the adequacy of model where F-Table value should be smaller than the F-calculated value [12]. From Tables 4 and 5 it is seen that model is to be statistically significant as probability of significance (p-value) is less than 0.05 and F-calculated value is greater than F-Table value (5.14). It is observed that the parameters mentioned in the model have significant effect on the response.
It is clear from ANOVA Table the p and F values are significant therefore the end results are proves that speed, feed depth of cut and tool nose radius have great impact on surface roughness and cutting force. The second order model equation (5) was used to plot contours of the surface roughness and cutting force for different values of cutting parameters. Figures 2 and 3 shows the cutting force and surface roughness contours of three different combinations of cutting parameters respectively. It is clear that increasing of cutting speed with decreasing of feed rate will decrease the surface roughness dramatically. Figure 3, shows that surface roughness reaches its highest value when cutting speed is medium associated with low depth of cut. To maintain the degree of cutting force and cutting temperature and also power consumption minimization was also one of the objectives of this research. Therefore from the ANOVA that feed rate and depth of cut have significant influence on the cutting force and surface roughness, the contour plot was developed. It can be observed that for power consumption minimization, the focus should be on choosing an appropriate combination of feed rate (<0.05 mm/rev) and depth of cut (<0.6 mm) (Fig. 2). Also for better surface roughness, the focus should be on choosing an appropriate combination of feed rate (<0.45 mm/rev) and depth of cut (<0.6 mm) (Fig. 3).
A good estimated regression model shall explain the variation of the dependent variable in the sample. There are certain tests of hypotheses about the model parameters that can help the experimenter in measuring the effectiveness of the model. The first of all, these tests require for the error term ε’s to be normally and independently distributed with mean zero and variances. To check this assumption, the normal probability and fitted values of residuals for the experiments are graphed as shown in Figure 4. Figure 4 shows the residual plots for cutting force (Fz) and surface roughness (Ra). The Figure 4a and b includes the normal probability plots of the residuals, the plots of the residuals vs. the predicted response for cutting force (Fz) and surface roughness (Ra). From the plots, it is observed that the residuals are fall on straight line which implies that the errors are distributed normally. This is attributed that the proposed models are adequate. And it does not suspect that it violate the functional relationship between the predictor and response.
Figure 5a and b shows the 3Dimensional (3D) surface graphs for cutting forces (Fz) and surface roughness (Ra). It is observed from the ANOVA analysis, the feed rate and depth of cut have significant effect on the responses and all surface graphs were plotted based on the feed rate and depth of cut. From all the 3D surface graphs; it is observed the curvilinear profile in according to the second order model that fitted with responses. It is clear from the Figure 5 that the lower cutting force is obtained at cutting speed levels at medium, feed rate at low and depth of cut is medium. Similarly observation was made for the surface roughness criteria (Ra). From the Figure 5b, it is observed the feed rate and depth of cut are the most variable parameter for cutting force. But for surface roughness the feed rate and cutting speed are the most variable factor. These graphs indicate that the feed rate and depth of cut increases the cutting force also increases.
The influence of process parameter on the cutting force (Fz) and surface roughness (Ra) were investigated by plotting the main effect plots. Figure 6a and b shows the main effect plots for the responses. It is observed that in Figure 6a, the cutting speed and feed rate are the important factor an increasing of surface roughness value. Whereas from Figure 6b it is also observed that, the depth of cut and feed rate gives better values of cutting force. The optimum process that yields minimum cutting force is at cutting speed 90 m/min, feed rate 0.04 mm/rev, depth of cut 0.5 mm and tool nose radius 0.4 mm. (Fig. 6b) Similarly, for surface roughness criteria, the process that yields minimum value is at cutting speed 75 m/min, feed rate 0.4 mm/rev, depth of cut 1 mm and tool nose radius 0.8 mm (Fig. 6a). For these optimized cutting condition the cutting force and surface roughness values are 7.69 kgf and 1.26 µm respectively.
ANOVA for surface roughness.
ANOVA for cutting force.
 |
Fig. 2 Contour plot for cutting force. (CS = 90 m/min., NR = 0.8 mm). |
 |
Fig. 3 Contour plot for surface roughness (mean 1). (CS = 90 m/min., NR = 0.8 mm). |
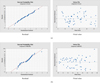 |
Fig. 4 (a) Residual plots for force, (b) residual plots for Ra. |
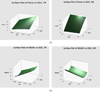 |
Fig. 5 (a) Surface plot of cutting force (CS = 90 m/min, NR = 0.8 mm), (b) surface plot of surface roughness (CS = 90 m/min, NR = 0.8 mm). |
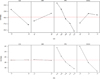 |
Fig. 6 (a) S/N ratio for surface roughness, (b) S/N ratio for cutting force. |
5.3 Validation of developed Model
In order to validate this model Tables 6 and 7 show the measured values, predicted values and percentage error while prediction using developed model. The range of the percentage error of surface roughness is within ±12% and cutting force is within ±5%. From these findings we can conclude the proposed model is validated.
Table 8 shows comparison of experimental and predicted surface roughness and cutting force values respectively at optimum condition (Reference experiment number 3 in Tabs. 6 and 7).
Comparison of experimental and predicted surface roughness values.
Comparison of experimental and predicted cutting force value.
Comparison of expt. and predicted (Ra and force) at optimum condition.
5.3.1 Graphical comparison
Figures 7 and 8 show the results of experiment of cutting force and surface roughness in the MQL turning of AISI 4340 with nano fluid. As illustrated in the graphs, the experimental cutting force and surface roughness values approximately matched the model prediction value. It confirmed the validity of experimental equation determined in the model equation. In case of surface roughness, the model value and experimental value showed small difference in some of the experimental trials but a similar tendency. This mismatch may be caused due to noise factor, uncontrolled parameter, lathe vibration and measuring error. Figures 7 and 8 show good agreement of predicted values with experimental values. Therefore it is concluded that estimated equations of surface roughness and cutting force are appropriate for accurate prediction and the proposed model is validated.
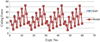 |
Fig. 7 Cutting force vs. expt. no. |
 |
Fig. 8 Surface roughness vs. expt. no. |
6 Conclusions
The following are the conclusions drawn based on the experiment conducted in MQL turning of alloy steel (AISI 4340) with nano fluid:
-
the mathematical model to predict surface roughness and cutting force is developed in context of input parameters speed, feed, depth of cut and tool nose radius for alloy steel (AISI 4340) material under MQL mode with nano fluid;
-
Tables 5 and 6 shows prediction error with associated with validation experiments. It shows maximum error by mathematical model to predict surface roughness average error is below ±11% whereas predicting cutting force the average error is below ±5%;
-
the results of ANOVA and conducting confirmation experiments proved that the predicted value of cutting force (Fz) and surface roughness (Ra) has a goodness of fit with quadratic model;
-
Figures 7 and 8 shows good agreement of predicted values with experimental values. Therefore it is concluded that estimated equations of surface roughness and cutting force are appropriate for accurate prediction and the proposed model is validated.
This research work was aimed at finding how process parameters in MQL turning with nano fluid operation affect the surface roughness of alloy steel (AISI 4340) and prediction of surface roughness and cutting force. The following is a list of suggested areas for further research to be conducted:
-
to achieve desired quality more focus should be on the right selection of the speed, feed and depth of cut;
-
by changing the concentration of nano particles with base fluid the effect of process parameters on the response variables should be studied;
-
more experiments are required for achieving higher order of the regression model for the development of a more accurate prediction model;
-
further extension of the proposed model for increasing its accuracy and reliability on the prediction of the tool wear is needed;
-
the developed model could be used to help to improves surface roughness and tool life while the level of the cutting force and temperature is maintained, e.g. introducing an optimisation procedure, etc.
References
- M.C. Shaw, Metal cutting principles, University Press, New York, Oxford, 2005 [Google Scholar]
- C. Bruni, F.F. Gabrielli, M. Simoncini, Effect of the lubrication-cooling technique, insert technology and machine bed material on the workpart surface finish and tool wear in finish turning of AISI 420B, Int. J. Mach. Tool. Manuf. 46 (2006) 1547–1554 [CrossRef] [Google Scholar]
- S. Debnath, M.M. Reddy, Q.S. Yi, Environmental friendly cutting fluids and cooling techniques in machining: a review, J. Clean. Prod. 83 (2014) 33–47 [CrossRef] [Google Scholar]
- N.R. Dhar, S. Islam, M. Kamruzzaman, Effect of minimum quantity lubrication (MQL) on tool wear, surface roughness and dimensional deviation in turning AISI 4340 steel, Gazi Univ. J. Sci. 20 (2007) 23–32 [Google Scholar]
- D.V. Lohar, C.R. Nanavte, Performance evaluation of minimum quantity lubrication (MQL) Using CBN tool during hard turning of AISI 4340 and its comparison with dry and wet turning, Int. J. Ind. Eng. Manag. Sci. 3 (2013) 102 [Google Scholar]
- B. Tasdelen, H. Thordenberg, D. Olofsson, An experimental investigation on contact length during minimum quantity lubrication (MQL) machining, J. Mater. Process. Technol. 203 (2008) 221–231 [CrossRef] [Google Scholar]
- B. Shen, Minimum quantity lubrication grinding using nano fluids (a dissertation submitted in partial fulfilment of the requirements for the degree of doctor of philosophy (Mechanical Engineering) in the University of Michigan, Michigan ), 2008 [Google Scholar]
- S. Prabhu, B.K. Vinayagam, Fractal dimensional surface analysis of AISI D2 Tool steel material with nanofluids in grinding process using atomic force microscopy, J. Braz. Soc. Mech. Sci. Eng. 33 (2011) 459–466 [CrossRef] [Google Scholar]
- F. Klocke, G. Eisenblatter, Dry cutting, CIRP 46 (1997) 519–525 [CrossRef] [Google Scholar]
- R.Q. Sardiñas, M.R. Santana, E.A. Brindis, Genetic algorithm-based multi-objective optimization of cutting parameters in turning processes, Eng. Appl. Artif. Intell. 19 (2006) 127–133 [Google Scholar]
- D. Singh, P.V. Rao, A surface roughness prediction model for hard turning process, Int. J. Manuf. Technol. 32 (2007) 1115–1124 [CrossRef] [Google Scholar]
- Y.K. Hwang, C.M. Lee, Surface roughness and cutting force prediction in MQL and wet turning process of AISI 1045 using design of experiments, J. Mech. Sci. Technol. 24 (2010) 1669–1677 [CrossRef] [Google Scholar]
- K. Venkatesan, R. Ramanujam, J. Joel, P. Jeyapandiarajan, M. Vignesh, D.J. Tolia, R. Venkata Krishna, Study of cutting force and surface roughness in machining of al alloy hybrid composite and optimized using response surface methodology, 12th global congress on manufacturing and management, GCMM, Procedia Eng. 97 (2014) 677–686 [CrossRef] [Google Scholar]
- B.A. Khidhir, W. Al-Oqaiel, P.M. Kareem, Prediction models by response surface methodology for turning operation, Am. J. Model. Optim. 3 (2015) 1–6 [Google Scholar]
- T. Walker, The MQL Handbook (Copyright © 2015 Unist, Inc. V1. 0.7), 2013, p. 1 [Google Scholar]
- M. Tomov, M. Kuzinovski, P. Cichosz, Development of mathematical models for surface roughness parameter prediction in turning depending on the process condition, Int. J. Mech. Sci. 113 (2016) 120–132 [CrossRef] [Google Scholar]
- A.R. Machodo, J. Wallbank, Effect of extremely low lubricant volumes in machining, Wear 210 (1997) 76–82 [CrossRef] [Google Scholar]
- N.R. Dhar, M. Kamaruzzaman, M. Ahmed, Effect of minimum quantity lubrication (MQL) on tool wear and surface roughness in turning AISI 4340 steel, J. Mater. Process. Technol. 172 (2006) 299–304 [CrossRef] [Google Scholar]
- N.R. Dhar, M.T. Ahmed, S. Islam, An experimental investigation on effect of minimum quantity lubrication in machining AISI 1040 steel, Int. J. Mach. Tools Manuf. 47 (2007) 748–753 [CrossRef] [Google Scholar]
- M.M.A. Khan, M.A.H. Mithu, N.R. Dhar, Effects of minimum quantity lubrication on turning AISI 9310 alloy steel using vegetable-oil based cutting fluid, J. Mater. Process. Techhnol. 209 (2009) 5573–5583 [Google Scholar]
- M.H. Sadeghi, M.J. Haddad, T. Tawakoli, M. Emami, Minimum quantity lubrication-MQL in grinding of Ti-6Al-4V titanium alloy, Int. J. Adv. Manuf. Technol. 44 (2009) 487–500 [Google Scholar]
- T. Tawakoli, M.J. Hadad, M.H. Sadeghi, Influence of oil mist parameters on minimum quantity lubrication-MQL grinding process, Int. J. Mach. Tools Manuf. 50 (2010) 521–531 [CrossRef] [Google Scholar]
- M. Emami, M.H. Sadeghi, A.A.D. Sarhan, Investigating the effects of liquid atomization and delivery parameters of minimum quantity lubrication on the grinding process of Al2O3 engineering ceramics, J. Manuf. Process. 15 (2013) 374–388 [CrossRef] [Google Scholar]
- A. Saini, S. Dhiman, R. Sharma, S. Setia, Experimental estimation and optimization of process parameters under minimum quantity lubrication and dry turning of AISI 4340 with different carbide inserts, J. Mech. Sci. Technol. 28 (2014) 2307–2318 [Google Scholar]
- A.S.S. Balan, L. Vijayaraghavan, R. Krishnamurthy, Minimum quantity lubricated grinding of inconel 751 alloy, Mater. Manuf. Process. 28 (2013) 430–435 [CrossRef] [Google Scholar]
- A. Attanasio, M. Gelfi, C. Giardini, C. Remino, Minimal quantity lubrication in turning: effect on tool wear, Int. J. Sci. Technol. Frict., Lubr. Wear 260 (2006) 333–338 [Google Scholar]
- P.B. Patole, V.V. Kulkarni, Experimental investigation and optimization of cutting parameters with multi response characteristics in MQL turning of AISI 4340 using nano fluid, Cogent Eng. (Taylor and Francis group) 4 (2017) 1303956 [Google Scholar]
- P.B. Patole, V.V. Kulkarni, Optimization of process parameters based on surface roughness and cutting force in MQL turning of AISI 4340 using nano fluid, in: Materials Today Procedings: PMME, 2016 [Google Scholar]
- N. Mandal, B.M. Doloi, B. Mondal, Optimization of flank wear using Zirconia Toughened Alumina (ZTA) cutting tool: Taguchi method and regression analysis, Measurement 44 (2011) 2149–2155 [CrossRef] [Google Scholar]
Cite this article as: Pralhad B. Patole, Vivek V. Kulkarni, Prediction of surface roughness and cutting force under MQL turning of AISI 4340 with nano fluid by using response surface methodology, Manufacturing Rev. 5, 5 (2018)
All Tables
All Figures
|
Fig. 1 Schematic diagram of experimental set up. |
| In the text | |
|
Fig. 2 Contour plot for cutting force. (CS = 90 m/min., NR = 0.8 mm). |
| In the text | |
|
Fig. 3 Contour plot for surface roughness (mean 1). (CS = 90 m/min., NR = 0.8 mm). |
| In the text | |
|
Fig. 4 (a) Residual plots for force, (b) residual plots for Ra. |
| In the text | |
|
Fig. 5 (a) Surface plot of cutting force (CS = 90 m/min, NR = 0.8 mm), (b) surface plot of surface roughness (CS = 90 m/min, NR = 0.8 mm). |
| In the text | |
|
Fig. 6 (a) S/N ratio for surface roughness, (b) S/N ratio for cutting force. |
| In the text | |
|
Fig. 7 Cutting force vs. expt. no. |
| In the text | |
|
Fig. 8 Surface roughness vs. expt. no. |
| In the text | |
Current usage metrics show cumulative count of Article Views (full-text article views including HTML views, PDF and ePub downloads, according to the available data) and Abstracts Views on Vision4Press platform.
Data correspond to usage on the plateform after 2015. The current usage metrics is available 48-96 hours after online publication and is updated daily on week days.
Initial download of the metrics may take a while.