| Issue |
Manufacturing Rev.
Volume 12, 2025
Advanced Manufacturing Research – Latest Developments
|
|
|---|---|---|
| Article Number | 14 | |
| Number of page(s) | 14 | |
| DOI | https://doi.org/10.1051/mfreview/2025009 | |
| Published online | 20 May 2025 | |
Original Article
Influence of polymer properties on the mechanical behaviour of 3D-printed auxetic metamaterials and honeycomb structures under bending load
1
Technische Hochschule Köln, Faculty of Computer Science and Engineering Science, Material Laboratory, Steinmüllerallee 1, 51643 Gummersbach, Germany
2
Technische Hochschule Köln, Faculty of Automotive Systems and Production, Manufacturing Technology, Betzdorfer Str. 2, 50679 Cologne, Germany
* e-mail: This email address is being protected from spambots. You need JavaScript enabled to view it.
a These authors contributed equally to this work.
Received:
31
October
2024
Accepted:
25
March
2025
Abstract
Metamaterials with auxetic behaviour have great potential for a new generation of load-bearing lightweight sandwich structures due to their outstanding energy absorption capabilities. As a result of their negative Poisson's ratio, component cross-sections increase under tensile loading transverse to the loading direction and decrease conversely under compressive loading. This paper describes experimental and numerical investigations with the finite element method on the load-deformation behaviour of sandwich structures under bending featuring differently oriented auxetic cores and honeycomb cores with varying specifications and degrees of crystallisation. A star-shaped auxetic structure was chosen and compared with hexagonal honeycomb cores. The fabrication of the specimens was carried out by fused deposition modelling and the materials were characterised by infrared spectroscopy, differential scanning calorimetry, melt flow index determinations, dilatometer measurements, tensile tests, and nanoindentation. The bending results exhibited that the advantages of the auxetic structures in energy absorption were clearly evident for certain orientations to the loading direction and that the material properties significantly influenced the structural deformation behaviour.
Key words: Auxetic metamaterials / fused deposition modelling / sandwich structure / three-point bending test / polymer characterisation
© D. Katrakova-Krüger et al., Published by EDP Sciences 2025
 This is an Open Access article distributed under the terms of the Creative Commons Attribution License (https://creativecommons.org/licenses/by/4.0), which permits unrestricted use, distribution, and reproduction in any medium, provided the original work is properly cited.
1 Introduction
Sandwich structures represent important load-bearing and functional components in areas where weight reduction is the priority, such as in aerospace, shipbuilding, high-speed rails, automotive and packaging [1,2]. These structures are typically consist of two thin face sheets bonded to a thicker cellular core, and provide a number of advantages for lightweight design, including low density, high specific strength and stiffness, notable properties in impact mitigation and energy absorption [1–4].
Cellular sandwich core structures can be classified into stochastic structures (metallic and polymeric foams), and periodic structures, which again can be categorised into 2D structures (honeycomb and prismatic) and 3D structures (truss and textile) [5]. Among the various core structures developed to date for sandwich components, auxetic metamaterials are of particular interest due to their unique mechanical properties and advantages compared to conventional materials [2,5]. Auxetic materials and structures are characterised by a negative Poisson's ratio, which results in an increase of a component's cross-section under tensile loading transverse to the loading direction and a corresponding decrease under compressive loading. This negative Poisson's ratio imparts several advantageous characteristics, such as enhanced indentation and shear resistance, plane strain fracture toughness, energy absorption and crash capability, which results in a decisive potential of auxetic cores for applications in sandwich structures [6]. The literature provides a comprehensive overview of the classification, applications, and future perspectives of auxetic materials and structures, e.g. [7–11].
In particular, the rapid developments in the field of additive manufacturing in recent years have paved the way to enable economic fabrication of new complex auxetic structures [8,12–14] and fused deposition modelling (FDM) is one of the most frequently applied additive manufacturing technique to fabricate auxetic structures in polymeric materials [14]. Although it is known that the large number of additive manufacturing parameters influence the final results in terms of mechanical properties and mechanical behaviour [14], only a few studies have focused on this subject in relation to the fabrication of auxetic structures. For example, [15] investigated the influence of irregularities in chiral honeycombs on the auxetic structure properties with the aid of finite element models. Such irregularities may result from the precision of the additive manufacturing process. [16] documented changes in the polymeric materials due to the printing process and printing defects in the auxetic structure. The effect of anisotropy in additive manufacturing on the printed auxetic structure was analysed by [17] and noticeable effects were found on the accuracy of simulation models in which anisotropy was taken into account.
Common methods to characterise sandwich structures are to use standardised mechanical loading tests and quasi-static three-point bending tests have proven to be an effective experimental procedure for the mechanical characterisation of the flexural behaviour of sandwich structures [1,18]. This test method has therefore been applied in various investigations on additively manufactured auxetic sandwich cores and systems made of polymers and metals: A series of newly developed auxetic structures were analysed experimentally and with simulations using 3-point bending tests [1,2,18,19]. Experimental and theoretical comparisons of sandwich structures between sandwich structures with auxetic and non-auxetic cores and conventional honeycomb structures have generally shown advantages of auxetic structures, such as enhanced energy absorption [20], a more stabilised penetration behaviour under low velocity impact [21], and a higher flexural strength to weight ratio [22]. The literature provides also various experimental and theoretical investigations into different configurations of auxetic cores for sandwich structures under bending [19,23–25], as well as a comparisons with their behaviour under other load cases, e.g. [16].
The investigations described in the present paper considers the Star-4 system as an auxetic sandwich core. These star-shaped structures are variants of re-entrant auxetic models [7] of auxetic structures. Their Poisson's ratio can be tailored by adjusting angles, ligament lengths and thicknesses of the star-shaped cells [26]. However, only a few publications address quasi-static 3-point bending of sandwich structures containing cores based on star-shaped auxetic systems but using metal materials: [19] developed a modified star-shaped cellular core structure and determined an enhanced energy absorption of this structure. For another modified star structure, an increase in stiffness was found in the bending test with fixed boundary conditions on both sides compared to alternative auxetic cell shapes [27].
The status of current scientific work on the properties of additively manufactured polymer-based sandwich structures with auxetic core characteristics shows that there is a need to better understand the interrelationships between the properties of the base material and the printed components, a factor rarely addressed in existing literature as discussed above. The published studies carried out on the use of additive manufacturing to date have been predominantly performed to exploit the potential of auxetic structures [14]. Against this background, the present work analyses the load-deformation behaviour of sandwich structures under quasi-static 3-point bending with differently oriented Star-4 auxetic cores and conventional honeycomb cores made of polylactide-based polymers (PLA) with different specifications and degrees of crystallisation and detailed characterisation was carried out for both the materials and printed components. The fabrication of the specimens was carried out by FDM.
2 Material and methods
2.1 Sandwich structures and materials
The investigations described here, analysed the additive manufacturing of the sandwich structures illustrated in Figure 1a. The nominal outer dimensions of all specimens for bending tests were l = 80 mm, w = 30 mm and h = 12 mm. The face sheets, printed together with the core structure had a thickness of s = 1 mm. Three core structure variants were analysed: a conventional honeycomb structure (G1) with the dimensions of the individual cell of a = 5.6 mm, t = 0.58 mm (Fig. 1b), and an auxetic Star-4 structure with the dimensions a = 4.9 mm, t = 0.42 mm (Fig. 1c), which was tested in two orientations (G2 and G3), as shown in Figure 1a and 1c. With regard to the selected core structures, the honeycomb structure (G1) was chosen because it is widely used in practical applications, such as aircraft construction [3,5], and is therefore well suited for comparison with the investigated auxetic structure. The auxetic Star-4 geometry (G2, G3) was chosen because this form of auxetic cell offers the possibility of flexibly adjusting the structure's Poisson's ratio via the stiffness of the hinges and ligaments [7,26], which allows for a wide range of applications. Several criteria were used to define the dimensions of the sandwich structures: (i) the dimensions of the samples should be aligned as far as possible with the dimensions of the standardised 3-point bending test DIN EN ISO 178:2019-08 for polymers, (ii) the height of the core structure in relation to the thickness of the face sheets should be sufficient to clearly show the effects of the core structure in the bending tests, and (iii) the dimensions of the sandwich structure had to be printable without defects. The latter presented a challenge insofar when cell sizes exceeded a specific threshold, when printing the transition from the cell walls to the upper face sheet, the bridging distance for the melted polymer was too large with the selected printing parameters and the face sheet could not be printed without failures. This determined the maximum applicable cell size of the G1 structure to print the upper face sheet without additional support structure that could not have been removed. The cells of the auxetic structure (G2, G3) were chosen to be of the same order of magnitude but presented fewer challenges during printing due to the smaller bridging distance. The weight of the G1 geometries was on average around 24% lower than that of the G2 components. A graded form of the Star-4 cells was selected along the length of the specimens with the angle θ = 36° of the cells in the centre and at the ends of the sandwich structure and 30° and 20° in the intermediate areas. A gradation of auxetic structures typically leads to improvements in mechanical properties [6]. Figure 1d additionally illustrates the intermediate stage of the printing simulation of the sandwich geometries G1, G2 and G3. For the dilatometry (DLM) measurements, smaller samples were printed in order to be able to place them in the corresponding device, although the cell sizes were maintained. The exact dimensions are provided in Section 2.3.
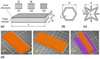 |
Fig. 1 Sandwich structure for experimental bending tests, (a) geometrical dimensions, (b) honeycomb cell geometry, (c) Star-4 cell geometry, (d) snapshots of the additive manufacturing simulation processes of the sandwich specimens. |
2.2 Materials and additive manufacturing
For the preparation of the samples, filaments of two commercial polylactide (PLA) thermoplastics were used. PLA was selected as a material for the present investigations for its advantageous characteristics. These include its production from renewable resources, biodegradability, favourable behaviour during printing in the printing process and the fact that this material has already been extensively investigated for application in additive manufacturing [28]. Furthermore, it is one of the most frequently used feedstock materials in FDM processes and is used for additive manufacturing in important industrial sectors such as medical technology and electronics [28]. As this study also aimed to investigate the influence of the base material on the printing results and since certain properties of the material may vary depending on the manufacturer [28], filaments from two different suppliers were used (PLA1, PLA2), one of which was formulated to crystallise when annealed (PLA2). This heat treatment was conducted at 95 °C for one hour (PLA2-t). The measured filament diameters were 1.75 mm for PLA1, 1.74 mm for PLA2 and 1.76 mm for the heat-treated filament PLA2-t. The individual filaments PLA1 and PLA2 were used for both auxetic core and face sheets. All specimens were fabricated using the commercial FDM printer the commercial 3D printer Original Prusa i3 MK3S+. The following parameters were selected for printing: layer thickness: 0.2 mm, nozzle temperature: 210 °C, print bed temperature: 60 °C, printing speed: 45 mm/s. These printing parameters were found to be appropriate in preliminary tests to create components without visible defects and were within the ranges recommended by the filament manufacturers. Five samples were prepared for each experimental test. The post-printing heat treatment for PLA2-t specimens was applied after printing using PLA2.
2.3 Experimental analyses
Universal testing machines were used to perform tensile tests on the filaments (device type: Zwick Z2.5/TN1S) and the 3-point bending tests (device type: Zwick Roell Z100 TEW) according to the standard DIN EN ISO 178:2019-08, applying a load cell with a maximum measuring force of 2.5 kN and bending speed of 2 mm/min. Figure 2 illustrates the bending test device and examples of specimens.
Melt flow rate (MFR) and melt flow-volume rate (MVR) measurements were conducted according to the standard DIN EN 1133-1 for the individual filament materials using a Zwick Roell Mflow device. The chemical structure of the filament materials was analysed via infrared spectroscopy (IRS) with an FTIR spectrometer (device type: Thermo Scientific Nicolet Nexus 470). Differential scanning calorimetry (DSC) was applied to samples of the printed specimens with a system of the type Netzsch DSC200PC. For dilatometer measurements (DLM), (device type: NETZSCH DIL 402C), sections of the sandwich structures according to Figure 1 were printed with the outer dimensions 16.5 mm x 5.3 mm x 5.3 mm and analysed in a temperature range up to 120 °C. For the comparison, solid samples were also prepared from PLA1 in three different build directions with these dimensions and analysed with DLM. Force controlled nanoindentation tests (NIT) were conducted on the printed sandwich structures with the system LNP nano touch, limiting the force to 1 N and using a rounded indenter with a radius of 0.1 mm of the indenter tip.
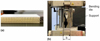 |
Fig. 2 Bending tests, (a) example of specimens, (b) 3-point bending setup (b: support spacing). |
2.4 Numerical modelling
In the present work two finite element models were developed, one to map the nanoindentation tests and a second to analyse the bending of the sandwich structure. The commercial finite element software Abaqus was used for modelling.
The aim of the model of the nanoindentation tests was to determine the material parameters of the printed polymer from the experimental indentation tests for a combination of a hyperelasticity material model and a plasticity model considering isotropic hardening in conjunction with optimisation techniques. The polymeric material was modelled as an axially symmetrical model penetrated by the indenter pin as a rigid surface. The material section consisted of a disc with a diameter of 1000 μm and a height of 500 μm, made up of 4-nodes axisymmetric solid bilinear elements (type CAX4R), with a total of 40,000 elements (Fig. 3a). The implicit procedure was chosen for computation. Experimental and theoretical work in [29] has demonstrated accurate predictions of the deformation behaviour of FDM fabricated auxetic structures made from a thermoplastic polymer with a hyperelastic material model. Against this background, hyperelasticity was assumed for the elastic behaviour of the polymer and the Arruda-Boyce model implemented in the finite element software was selected [30]. This model describes the hyperelastic potential as follows:
 (1)
(1)
where μ is the material's shear modulus, Ci are coefficients from a series expansion of the inverse Langevin function, λm is the locking stretch, I1 the first strain invariant, D a material parameter, and Jel the elastic volume strain.
Plastic deformation of the sandwich structures was considered by applying the Johnson-Cook plasticity model [31] which assumes isotropic hardening and determines the static yield stress in the form:
 (2)
(2)
with the material parameters A, B, n and m, the equivalent plastic strain εe and the nondimensional temperature ϑ that is zero for material temperatures below transition temperature.
Automated simulations were conducted to determine the material parameters μ, λm, D, A, B and n, applying the simulation model of the nanoindentation test described above and the commercial program system Isight. The values μ, λm and D were systematically varied based on the values determined from the tensile tests of the filament and were optimised together with the values A, B and n, in such a way that the load and unloading curve hit points P1 and P2 in the load-displacement curve of the nanoindentation test shown in Figure 3b. The Pointer optimisation technique implemented in Isight was used for the optimisation that is working with a combination of genetic algorithm, Nelder-Mead downhill simplex sequential programming and linear algorithms.
To simulate the bending process, a single auxetic cell was modelled at the bending stress maximum of the sandwich structure in order to obtain higher resolutions of the stress state (Fig. 4). The model was designed from 4-node, quadrilateral, stress/displacement shell elements of the type S4R with a total number of approximately 10,000 elements. As boundary conditions, transverse forces were neglected, lateral movement at the section planes was suppressed and flat cross-sections at all section planes was imposed.
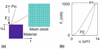 |
Fig. 3 Nanoindentation modelling, (a) axisymmetric finite element model, (b) load-displacement curve. |
 |
Fig. 4 Modelling of the sandwich structures with auxetic and honeycomb core (My: bending moment). |
3 Results
3.1 Filament analysis
The tensile tests carried out on the filaments of the three materials in Figure 5 show clear differences in both the maximum stress values and the elongation at break. Material PLA1 provided on average approximately 12% lower maximum stress values compared to PLA2 and 32% lower maximum strain values. The heat treatment of PLA2 led to a decrease in the maximum tensile stress of about 30%, but to an increase in the maximum elongation of 261%. This can be explained by the heat shrinkage known from fibers. For the filament also a stretching and molecular chain orientation in the amorphous phase occur during extrusion. The stretched polymer chains are relaxing at higher temperature transitioning into the energetically favourable tangled up state. This leads to higher elongation at break as the macromolecules need to be stretched first. There was also observable macroscopic undulation in the filament also contributing to this higher value. The maximum stress is correspondingly lower due to the lost chain orientation. If there is higher crystallisation degree after the heat treatment as intended it cannot be detected by the tensile tests as the heat shrinkage effect is much more dominant.
The measurements of MFR (and MVR) resulted in slightly lower values for the PLA2 filament material compared to PLA1 of 23.4 g/10min and 25 cm3/10 min, respectively (Fig. 6). The difference could be due to higher crystallinity for PLA2 or higher molecular weight, also indicated by the observed increase in tensile strength. For the heat-treated variant PLA2-t, however, the MFR and MVR values were around 32% lower than those of PLA2. This indicates a higher crystallinity grade due to recrystallisation occurred during the heat treatment as supported by the DSC measurements (see below).
Figure 7 depicts the FTIR spectra of the untreated PLA1 and PLA2 and the heat-treated PLA2-t filaments. All three materials exhibited the characteristic stretching frequencies for C=O, −CH3 asymmetric, −CH3 symmetric, and C–O, at the wavenumbers 1746, 2995, 2946 and 1080 cm−1, respectively. At wavenumbers 1452 and 1361 cm−1, bending frequencies for −CH3 asymmetric and −CH3 symmetric have been determined, respectively. The FTIR spectra of the three materials were similar and corresponded to the library spectra for PLA (see for example [32]). No significant change by the heat treatment was observed.
Figure 8 shows the results of the DSC measurements for the three materials. The first heating (Fig. 8a) showed a similar glass transition temperature of 60 °C for PLA1 and PLA2, and a melting peak of about 160 and 180 °C, respectively. The lower melting point of PLA1 may be related to lower molecular weight or to a lower degree of crystallinity, which fits well to the higher MFR value compared to PLA2 (Fig. 6) and the associated lower viscosity as well the lower tensile strength. The degree of crystallinity derived from the DSC curves was 2.59% for PLA1, 7.74% for PLA2 and 41.65% for PLA2-t. The melting temperature of PLA2-t corresponded approximately to that of PLA2. A peak prior to the melting point indicates a possible post-crystallisation for the two materials that was at a temperature of 110 °C for PLA1 and at 95 °C for PLA2. after tempering PLA2 to PLA2-t, this post-crystallisation peak was no longer present in PLA2-t. (Fig. 8a). The curves also show that the peaks for material PLA1 are broader than those for the other materials, which indicates a broader distribution of the molecular weight of PLA1 which which also contributes to higher flowability. In the second heating curves (Fig. 8b) after a rapid cooling the post-crystallisation peak appears for all materials, also for PLA2-t in contrast to the first heating. The decomposition temperature was measured at around 360 °C for the materials.
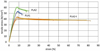 |
Fig. 5 Result of filament tensile tests. |
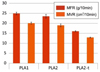 |
Fig. 6 Measurement of melt flow rate and melt volume-flow rate. |
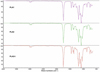 |
Fig. 7 Results of FTIR analyses of the filaments. |
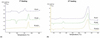 |
Fig. 8 Differential scanning calorimetry of the filaments, (a) first heating, (b) second heating. |
3.2 Dilatometer measurements
The DLM of the printed sandwich geometries have shown that all geometries and materials provided similar behaviour up to the glass transition temperature but significant differences in the progress of the recorded curves above this temperature (Fig. 9). This behavior is related to the higher mobility of the polymer chains above the glass transition and the relaxation of the oriented chains in the filaments. After passing through the glass transition temperature, all sandwich structures made from PLA1 exhibited first decreasing negative values of the ratio of length change dL to initial length L0 in the respective measuring directions with increasing temperatures, followed by a further slight increase from around 100 °C and with a gradient similar to before the glass transition temperature. This decrease was less pronounced for the workpieces made from PLA2 but the amount of decrease and the temperatures from which an increase in length took place again were not uniform for the individual sandwich structures. The specimens made from PLA2-t, on the other hand, exhibited a continuous increase of dL/L0 with increasing temperature, with one exception in the measurement of G1 in the y-direction. For the material PLA1, using the example of a specimen printed as a solid workpiece, Figure 9 shows that the decrease in elongation in the x- and y-directions also occurred here, while an increase was observed in the build direction (z). The heat shrinkage due to the orientation relaxation phenomena strongly influences the behaviour of the printed parts.
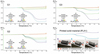 |
Fig. 9 Dilatometer measurements of printed structures. |
3.3 Nanoindentation at 3D printed sandwich components
Figure 10 summarises the results for the stiffness values of the printed sandwich structures measured at various points using nanoindentation. The results from five measurements each in the area of the individual measuring point exhibited a comparatively large scattering overall, which is attributed to the roughness of the surfaces and some unevenness attributed to the border areas of the printed layers. The mean values of structures G1 and G2 generally exhibited slightly higher values for the face sheets at the top in the build direction compared to the bottom ones. The stiffness values of the face sheets of the G3 structure, which was printed rotated by 90° compared to G1 and G2, were approximately up to three times higher. This demonstrated a noticeable influence of the build direction on the measured values in the respective component areas. For the honeycomb core structure of G1 the mean values were between the values of the face sheets. The stiffness of the Star-4 structure could not be measured attributed to insufficient accessibility. With regard to the influence of the individual material on the stiffness, it was difficult to make a clear statement based on the measurement results.
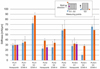 |
Fig. 10 Results of nanoindentation tests. |
3.4 Results of bending tests
The investigated bending specimens with the geometries G1 and G2 were bent until fracture and all revealed a uniform and largely non-linear load-displacement curve like shown in Figure 11a, whereby the curves of the G1 geometries exhibited a slightly higher gradient in the initial phase compared to the curves of the G2 geometries. Depending on the material, the mean bending forces determined for the G1 and G2 geometries analysed were slightly higher for the G1 components than for the G2 components, where the scattering ranges for the material PLA1 overlapped (Fig. 11b). It is noticeable that this difference in the mean maximum bending force between G1 and G2 was merely 3.6% for the components made of PLA1, but around 30% for those made of PLA2 and PLA2-t. Also, it is remarkable that the material PLA2, for which higher strengths of the starting filament were measured compared to PLA1 (Fig. 5), provided around 26% lower strength under bending for the G1 geometry and 41% for the G2 geometry (Fig. 11b). For the tempered material PLA2-t, for which higher strengths of the components made from it were expected, but which had already not been proven in the tests on the original filament, the components' strength under bending was around a tenth lower than those of the components made from the untempered material PLA2 (Fig. 11b). The fracture behaviour was comparatively brittle in all cases, with low plastic deformation and all specimens broke into two parts (Fig. 11c).
Figure 12 shows the results of the bending tests of the G3 geometry with the Star-4 core for the three investigated materials. The tests were carried out until either failure occurred or the sample ends left the support points of the bending tool. Independent from the material, all components exhibited a pronounced increase in bending force in the second half of the bending path (Fig. 12a), however, the mean value of the maximum force reached in this phase for the workpieces made of PLA1 was around 45% and 64% higher than that of the components made of PLA2 and PLA2-t (Fig. 12b). Towards the end of the bending process, the samples exhibited a more or less distinct localised delamination between the core structure and the face sheets of the sandwich structure. Only in the workpieces from PLA2-t this delamination was so significant that the bending process was stopped in four out of five tests due to a rapid drop in bending force between about 60 and 90% of the maximum stroke that was determined for the samples from PLA1 and PLA2.
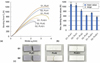 |
Fig. 11 Bending test results of geometries G1 and G2, (a) examples of measured bending forces, (b) summary of maximum bending force values, (c) examples of specimens after bending until fracture. |
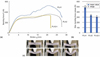 |
Fig. 12 Bending test results of geometry G3, (a) examples of measured bending forces, (b) summary of maximum bending force values, (c) example of intermediate stages during bending. |
3.5 Material parameter determination
In Figure 13a the load-displacement curves are shown of the experimental nanoindentation tests and of the simulation with the material parameters found by using the optimisation technique described above. For the experimental curves a certain scattering was determined. Possible reasons assumed for this were irregularities of the workpiece surface, stiffness of the sandwich structure and possible inhomogeneities in the printed material. Therefore, for the material parameter determination in the equations (1) and (2) for the printed polymer mean values of the experimental values were selected for the target points P1 and P2 (Fig. 3b), and the following values were found for the material parameters: μ = 643.94 MPa, λm = 7,
D = 6.52 · 10−4 MPa−1, A = 64 MPa, B = 15 MPa and n =0.06. The experimental behaviour of the nanoindentation was reproduced comparatively good by the simulation with these material parameters, as can be seen in Figure 13a. However, the experimental values exhibited a slight deviation in the gradient of the load-displacement curves during loading and unloading. The equivalent stress and equivalent plastic strain in the material caused by the indenter tip at loading (P1) and unloading (P2) is depicted in Figure 13b and it is evident that the elasticity limit of the material has been exceeded.
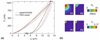 |
Fig. 13 Material parameter identification by nanoindentation, (a) load-displacement curves, (b) simulation result of equivalent stress (σe) and equivalent plastic strain (εe) distribution. |
3.6 Finite element analysis
The comparison of results of the simulation model reduced to one auxetic cell (Fig. 4) with the experiment as normalised values is depicted in Figure 14. The bending moment Mmax and deformation umax at the maximum point of the bending force at the corresponding point of the specimen were calculated analytically and used for the normalisation of the values. From Figure 14 it is evident that the progression of the simulated curve is comparable to the experimental one, but provide higher necessary forming loads overall. The deviations are attributed to the influence of the simplifications selected for the simulation model as well as to possible structural inhomogeneities and anisotropy of the printed specimens due to additive manufacturing [17].
Figure 15 depicts the simulation results of the bending tests of the G1 and G2 geometries in the tensioned face sheet of the outer bend of the bent part based on the model of a single cell of the sandwich structure. The bending moment applied in the simulation corresponded to the theoretical bending moment of the experiments at the maximum bending force. It is apparent in Figure 15 that the distribution of equivalent stress σe, main principal stress σI and strain in x-direction εx in the face sheet under tensile stress on the outside of the bend for the G2 geometry with Star-4 core is more evenly distributed overall than for the G1 geometry with the honeycomb core. This opens up opportunities for material savings. However, in the variant of core structures considered, it provided locally slightly higher stresses in the face sheet than the honeycomb structure. While the maximum value for σe, of G1, for example, was around 54 MPa, G2 exhibited a local maximum of 56 MPa at two nodal points where the auxetic structure is connected to the face sheets. The higher strain values of G2 compared to G1, which were locally up to 16% higher at the points of the stress maxima, provide an explanation for the larger gradient of the load-displacement curves of the experiments for the G1 geometries in Figure 11.
Furthermore, the developed simulation model was applied to analyse the influence of different wall thicknesses of the auxetic structure on the stress distribution in the face sheets of the sandwich construction. The cases of a uniform wall thickness (t1 = t2 = 0.2 mm) and of increased wall thicknesses of t1 = 0.4 mm and 0.6 mm transverse to the main load direction were analysed (Fig. 16a). In the simulations, a bending moment was applied that has led just to the onset of plastic yielding in the experiments. Figures 16b and 16c show the equivalent stress in the face sheet that is under tensile stress during bending for the different star dimensions. The stresses are distributed non-uniformly along the surface. For t1 = 0,2 mm, these differences are approximately 2.5 MPa in x-direction and approximately 1 MPa in y-direction (Fig. 16c). If t1 increased, these stress differences increased, whereby the stresses were reduced overall in the y-direction. A doubling of t1 led to an increase in the stress differences of approximately 60%.
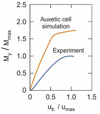 |
Fig. 14 Comparison of normalised bending moment versus normalised displacement of the auxetic cell simulation and experimental 3-point-bending tests. |
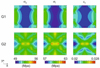 |
Fig. 15 Results of Finite Element simulation in the tensioned face sheet of the outer bend of the bent part for the G1 and G2 core structure. |
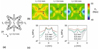 |
Fig. 16 Simulation results on the influence of different wall thicknesses in the tensioned face sheet of the outer bend of the bent part of the auxetic core structure, (a) Star-4 wall thicknesses, (b) distribution of σe, (d) σe along x- and y-direction. |
4 Discussion
4.1 Characteristics of the filament polymers and effects on printing
The analyses carried out on the characterisation of the filament materials investigated have shown that differences in the degree of crystallinity and the molecular weight distribution can be attributed to the materials PLA1 and PLA2, which otherwise were largely identical in terms of their chemical composition. This provides a possible explanation as to why the material PLA2, with its higher crystallinity compared to PLA1, provided higher strengths in the tensile test (Fig. 5), but lower bending strengths in the printed sandwich components (Fig. 11). In the case of filaments that solidify with a semi-crystalline structure after melting, compared to an amorphous state, it must be assumed that the interdiffusion and interlayer bonding between an already created layer in the additive printing process and the application of a new one is impeded due to the reduced macromolecular mobility [28]. This reduces the bonding strength between the individual layers and thus the strength of the component produced. In addition, the temperature difference between the measured melting points of the filaments and the here applied nozzle temperature − recommended by the filament manufacturers − was around 20 °C higher for the material PLA1 than for PLA2. This was associated with a lower viscosity of the applied PLA1 material and a higher layer adhesion was to be expected [28]. The higher melting temperature for PLA2 also contributed to its higher viscosity which was also observed in the MFR results. The unexpected behaviour of the PLA2 filament after heat treatment is attributed to the consequences of heat shrinkage. This effect appears to be much more dominant than the post-crystallisation. However, a more precise explanation requires further investigations, e.g. on the temperature- and stress-dependent morphology of the filament.
4.2 DLM analysis and component properties
The dilatometer measurements have shown that significant differences in the expansion behaviour of the investigated geometries, materials and build directions only occurred after the glass transition temperature has been exceeded (Fig. 9). Above this temperature, influences of the material behaviour and build direction on the thermal expansion behaviour were more pronounced than those of the selected specimen geometry. In particular, the non-tempered samples made from PLA1 and PLA2 initially exhibited distinct negative strain values after passing through the glass transition temperature, which increased again from certain temperatures. A plausible explanation for this observed reduction in length with increasing temperature is the closing of voids, which has already been observed in the tempering of printed workpieces made of PLA [33]. However, this effect appeared to be preferentially transverse to the build direction (z), as an increase in length was determined in the z-direction within the relevant temperature range (Fig. 9). The closing of voids also provides an explanation for the fact that the annealed samples from PLA2-t did not show almost any reduction in dimensions with increasing temperatures, as the cavities were already closed during the annealing process. However, the question still remains as to why the bending strengths of the tempered samples were lower than those of the untempered samples (Figs. 11 and 12) and the strength values for the components made of PLA1 were the highest, although the largest reductions in length were measured which would mean the presence of a large pore volume. The previously described differences between the materials in the formation of the layer adhesion is seen as a possible explanation for this. An additional effect is for sure the heat shrinkage of the filament due to the orientation relaxation. This must be investigated systematically also in relation to the build direction.
4.3 Material parameter determination by nanoindentation tests and modelling
The nanoindentation tests revealed two important issues. Firstly, the stiffness values measured on surfaces parallel to the build direction were higher than those on surfaces transverse to it. This may offer the potential to determine anisotropic properties of printed components by nanoindentation. Secondly, it was shown that the parameters for a combined hyperelastic-plastic material law could be derived from the measured force-displacement curves in conjunction with automated simulation runs and optimisation techniques. However, the analyses carried out here to characterise the basic material and printed components suggest that further parameters for the anisotropy and homogeneity of the printed component should be implemented in a simulation model in order to improve the quality of the simulation results.
4.4 Design of the sandwich core structure and behaviour under static bending
Regarding the investigations into the behaviour of the sandwich structures under bending, the assumed differences in the adhesive strength of the printed layers for the different materials mentioned above can explain the different bending strengths of the geometries that were produced from them. In addition, the wall thickness of the auxetic core structure for G2, which was around 28% thinner than the honeycomb structure for G1, was likely to have had larger influences of possible weak points and pores between the printed lines and layers on the inner cohesion of the structure, resulting in reduced strengths (Fig. 11). However, for an improved cohesion (PLA1 in Fig. 11), the investigated G1 and G2 structures have shown to be comparable, whereby the auxetic G2 geometry still offers potential for weight saving and improvement, as the simulations carried out have demonstrated (Fig. 15). Furthermore, the experiments on bending the auxetic G3 geometry have shown that with improved cohesion of the printed structure (PLA1 in Fig. 12), a high energy absorption capacity can be achieved under bending stress. The results of theoretical investigations of the influence of different wall thicknesses of the auxetic Star-4 structure on the sandwich face sheets have shown that the possibility of adjusting the transverse contraction behaviour of the auxetic structure by dimensioning the individual cell elements [26] can be applied to influence the stress state in the face sheets of a sandwich structure. This can be used, for example, for wall thickness optimisations and thus to save weight and to adjust the transverse loads of the matrix material in the face sheets.
5 Conclusion
The presented work dealt with experimental investigations into the properties of different PLA materials for the use as printing materials by fused layer modelling of honeycomb and auxetic structures. The key findings of the work carried out can be summarised as follows:
The degree of crystallinity and the crystallisation behaviour of the molten and solidifying filament material can be expected to have a significant influence on the strength of the printed layer composite, while the chemical composition alone does not allow a conclusion to be drawn about the strength behaviour without further ado. In the present case, the investigated polymers exhibited identical chemical compositions but recognisable differences in thermal and mechanical behaviour, both in the initial state as filament and in printed form. High mechanical strengths and strain values of the filament did not correlate with higher strengths and strains of the printed component under bending loads. Although the tensile strength values of the PLA1 filament (initial crystallinity 2.59%) were 12% lower than those of the PLA2 filament (initial crystallinity 7.84%), the transferable bending forces for the specimens with the G1 geometry made from PLA2 were 26% lower than those for the components made from PLA1 and 41% lower with the G2 geometry. It is assumed that the layer adhesion resulting from the crystallinity of the starting material and its crystallisation behavior during printing together with the printing parameters had a significant influence on the experimental results as well as the heat shrinkage of the filament during the printing process.
Dilatometer measurements have demonstrated that the influences of the material behaviour and build direction on the thermal expansion behaviour were more pronounced than those of the selected core structures, however, with varying degrees of anisoptropic behaviour of the structures. It is assumed that the heat shrinkage due to the orientation relaxation phenomena contributed significantly to the effects observed in the DLM tests. Above the glass transition temperature, all sandwich structures made from PLA1 revealed first decreasing negative values of length change with increasing temperatures, followed by a further slight increase from around 100 °C. This behaviour was similar but less pronounced for the specimens made from PLA2. The heat-treated specimens made from PLA2-t, however, exhibited a continuous increase of dL/L0 with increasing temperature, with one exception in the measurement of G1 in the y-direction. For a sample of material PLA1 printed as a solid part, an increase in length above the glass transition temperature was observed only in the build direction with increasing temperature, while in the transverse directions a decrease occurred.
The nanoindentation tests of the printed components revealed that the behaviour of the workpiece was highly dependent on the direction in which the workpiece was printed. The mean values of the measured stiffnesses of the face sheets printed in the vertical direction (G3) were higher by a factor of 3 compared to the face sheets printed in the horizontal direction (G1, G2). However, a certain scatter in the nanoindentation measurements of the nanoindentation measurements was observed, which was attributed to the roughness of the surfaces and some unevenness due to the border areas of the printed layers. Furthermore, it was shown that with the results of nanoindentation tests and tensile tests a parameterisation of a combination of a hyperelastic and plastic material law was possible that could be applied for FE analyses. However, further investigations that take into account anisotropy and inhomogeneity of the printed structure appear to be reasonable.
The experimental three-point bending tests revealed that the comparability of the different sandwich core structures was highly dependent on the material used. While the bending tests with the geometries G1 and G2 made from PLA1 exhibited comparable behaviour in terms of strength, for the material variants PLA2 and PLA2-t, differences in the transferable forces of around 30% were determined between the two geometries. This was attributed to the approximately 28% thinner wall of the G2 structure compared to G1 and thus greater susceptibility to possible printing defects, which were to be expected with a higher probability for these material variants. Depending on the orientation of the auxetic structure, either brittle fracture behaviour with high load-bearing capacity (G1, G2) or high ductility with high energy absorption (G3) was observed for the experimental bending tests of the printed sandwich structures. Furthermore, with the developed simulation model, it was possible to show that the local stress state in the face sheets of a sandwich construction under bending loads can be influenced by dimensioning geometry parameters of the auxetic cell. Further investigations with a broader analysis of the auxetic geometry parameters and comparative studies with other sandwich core structures are suggested.
Acknowledgments
Thanks are due to Dr Thomas Haenel und Claire Strasser von Netzsch Gerätebau GmbH, Selb, Germany, for the support with the interpretation of the thermal analysis and rheology data.
Funding
This contribution has been developed in the project PLan_CV. Within the funding programme FH-Personal, the project PLan_CV (reference number 03FHP109) is funded by the German Federal Ministry of Education and Research (BMBF) and Joint Science Conference (GWK).
Conflicts of interest
The authors declare that there are no financial conflicts of interest concerning this publication.
Data availability statement
All data supporting the results of the described research study are available in the publication and no additional datasets were generated.
Author contribution statement
Danka Katrakova-Krüger: Conceptualisation, Methodology, Investigations, Characterisations, Review & Editing, Sarah Spicale: Methodology, Investigations, Christoph Hartl: Conceptualisation, Methodology, Investigations, Supervision, Writing, Review & Editing.
References
- H. Wang, J. Shao, W. Zhang, Z. Yan, Z. Huang, X. Liang, Three-point bending response and energy absorption of novel sandwich beams with combined re-entrant double-arrow auxetic honeycomb cores, Compos. Struct. 326 (2023) 117606 [CrossRef] [Google Scholar]
- L. Li, Q. He, X. Jing, Y. Jiang, D. Yan, Study on three-point bending behavior of sandwich beams with novel auxetic honeycomb core, Mater. Today Commun. 35 (2023) 106259 [CrossRef] [Google Scholar]
- Y. Karsandik, B. Sabuncuoglu, B. Yildirim, V.V. Silberschmidt, Impact behavior of sandwich composites for aviation applications: A review, Compos. Struct. 314 (2023) 116941 [CrossRef] [Google Scholar]
- H. Guo, H. Yuan, J. Zhang, D. Ruan, Review of sandwich structures under impact loadings: Experimental, numerical and theoretical analysis, Thin-Wall. Struct. 196 (2024) 111541 [CrossRef] [Google Scholar]
- Q. Ma, M.R.M. Rejab, J.P. Siregar, Z. Guan, A review of the recent trends on core structures and impact response of sandwich panels, J. Compos. Mater. 55 (2021) 2513 [CrossRef] [Google Scholar]
- C. Li, H.-S. Shen, H. Wang, Nonlinear bending of sandwich beams with functionally graded negative Poisson's ratio honeycomb core, Compos. Struct. 212 (2019) 317 [CrossRef] [Google Scholar]
- X. Ren, R. Das, P. Tran, T.D. Ngo, Y.M. Xie, Auxetic metamaterials and structures: a review, Smart Mater. Struct. 27 (2018) 023001 [CrossRef] [Google Scholar]
- Z. Wang, C. Luan, G. Liao, J. Liu, X. Yao, J. Fu, Progress in auxetic mechanical metamaterials: Structures, characteristics, manufacturing methods, and applications, Adv. Eng. Mater. 22 (2020) 2000312 [CrossRef] [Google Scholar]
- M.P. Balan, A.J. Mertens, M.V.A. Raju Bahubalendruni, Auxetic mechanical metamaterials and their futuristic developments: A state-of-art review, Mater. Today Commun. 34 (2023) 105285 [CrossRef] [Google Scholar]
- H. Yin, W. Zhang, L. Zhu, F. Meng, J. Liu, G. Wen, G. Review on lattice structures for energy absorption properties, Compos. Struct. 304 (2023) 116397 [Google Scholar]
- Y. Liu, C. Zhao, C. Xu, J. Ren, J. Zhong, Auxetic meta-materials and their engineering applications: a review, Eng. Res. Express 5 (2023) 042003 [CrossRef] [Google Scholar]
- A. Joseph, V. Mahesh, D. Harursampath, On the application of additive manufacturing methods for auxetic structures: a review, Adv. Manuf. 9 (2021) 342 [CrossRef] [Google Scholar]
- D. Wannarong, T. Singhanart, A review of sandwich composite structures with 3D printed honeycomb cores, Eng. J. 26 (2022) 27 [CrossRef] [Google Scholar]
- D. Mocerino, M.R. Ricciardi, V. Antonucci, I. Papa, Fused deposition modelling of polymeric auxetic structures: A review, Polymers 15 (2023) 1008 [CrossRef] [Google Scholar]
- L. Mizzi, D. Attard, R. Gatt, A.A. Pozniak, K.W. Wojciechowski, J.N. Grima, Influence of translational disorder on the mechanical properties of hexachiral honeycomb systems, Compos. Part B 80 (2015) 84 [CrossRef] [Google Scholar]
- I.K. Türkoglu, H. Kasim, M. Yazici, Experimental investigation of 3D-printed auxetic core sandwich structures under quasi-static and dynamic compression and bending loads, Int. J. Prot. Struct. 14 (2023) 63 [CrossRef] [Google Scholar]
- B. Ashfaq, G. Hussain, M.B. Khan, M. Ilyas, Mechanical characterisation of innovative 3D‑printed auxetic (NPR) structures: Role of considering anisotropy on accuracy of numerical modeling, Int. J. Adv. Manuf. Technol. 130 (2024) 4845 [CrossRef] [Google Scholar]
- N.K. Choudhry, S.R. Bankar, B. Panda, H. Singh, Experimental and numerical analysis of the bending behavior of 3D printed modified auxetic sandwich structures, Mater. Today: Proc. 56 (2022) 1356 [CrossRef] [Google Scholar]
- X. Zhao, L. Wei, D. Wen, G. Zhu, Q. Yu, Z.D. Ma, Bending response and energy absorption of sandwich beams with novel auxetic honeycomb core, Eng. Struct. 247 (2021) 113204 [CrossRef] [Google Scholar]
- T. Li, L. Wang, Bending behavior of sandwich composite structures with tunable 3D-printed core materials, Compos. Struct. 175 (2017) 46 [CrossRef] [Google Scholar]
- S. Hou, T. Li, Z. Jia, L. Wang, Mechanical properties of sandwich composites with 3D-printed auxetic and non-auxetic lattice cores under low velocity impact, Mater. Des. 160 (2018) 1305 [CrossRef] [Google Scholar]
- D. Harland, A.W. Alshaer, H. Brooks, An experimental and numerical investigation of a novel 3D printed sandwich material for motorsport applications, Procedia Manuf. 36 (2019) 11 [CrossRef] [Google Scholar]
- Y. Hou, Y.H. Tai, C. Lira, F. Scarpa, J.R. Yates, B. Gu, The bending and failure of sandwich structures with auxetic gradient cellular cores, Compos. Part A 49 (2013) 119 [CrossRef] [Google Scholar]
- B.L. Liu, S. Li, Y.S. Li, Bending of FGM sandwich plates with tunable auxetic core using DQM, Eur. J. Mech. A Solids 97 (2023) 104838 [CrossRef] [Google Scholar]
- A. Hamrouni, J.-L. Rebiere, A. El Mahi, M. Beyaoui, M. Haddar, Experimental and numerical investigation of the static behavior of a 3D printed bio-based anti-trichiral sandwich, J. Compos. Mater. 57 (2023) 2161 [CrossRef] [Google Scholar]
- P.-S. Farrugia, R. Gatt, D. Attard, F.R. Attenborough, K.E. Evans, J.N. Grima, The auxetic behavior of a general Star-4 structure, Phys. Status Solidi B 258 (2021) 2100158 [CrossRef] [Google Scholar]
- H. Lu, X. Wang, T. Chen, Quasi-static bending response and energy absorption of a novel sandwich beam with a reinforced auxetic core under the fixed boundary at both ends, Thin-Wall. Struct. 191 (2023) 111011 [CrossRef] [Google Scholar]
- D. Vaes, P. Van Puyvelde, Semi-crystalline feedstock for filament-based 3D printing of polymers, Prog. Polym. Sci. 118 (2021) 101411 [CrossRef] [Google Scholar]
- Y. Schneider, V. Guski, S. Schmauder, J. Kadkhodapour, J. Hufert, A. Grebhardt, C. Bonten, Deformation behavior investigation of auxetic structure made of poly(butylene adipate-co-terephthalate) biopolymers using finite element method, Polymers 15 (2023) 1792 [CrossRef] [Google Scholar]
- E.M. Arruda, M.C. Boyce, A three-dimensional constitutive model for the large stretch behavior of rubber elastic materials, J. Mech. Phys. Solids 41 (1993) 389 [CrossRef] [Google Scholar]
- G.R. Johnson, W.H. Cook, Fracture characteristics of three metals subjected to various strains, strain rates, temperatures and pressures, Eng. Fract. Mech. 21 (1985) 31 [CrossRef] [Google Scholar]
- J.-R. Riba, R. Cantero, V. Garcia-Masabet, J. Cailloux, T. Canals, M.L. Maspoch, Multivariate identification of extruded PLA samples from the infrared spectrum, J. Mater. Sci. 55 (2020) 1269–1279 [CrossRef] [Google Scholar]
- N. Jayanth, K. Jaswanthraj, S. Sandeep, N. Harish Mallaya, S. Raghul Siddharth, Effect of heat treatment on mechanical properties of 3D printed PLA, J. Mech. Behav. Biomed. Mater. 123 (2021) 104764 [CrossRef] [Google Scholar]
Cite this article as: Danka Katrakova-Krüger, Sarah Spicale, Christoph Hartl, Influence of polymer properties on the mechanical behaviour of 3D-printed auxetic metamaterials and honeycomb structures under bending load, Manufacturing Rev. 12, 14 (2025), https://doi.org/10.1051/mfreview/2025009
All Figures
|
Fig. 1 Sandwich structure for experimental bending tests, (a) geometrical dimensions, (b) honeycomb cell geometry, (c) Star-4 cell geometry, (d) snapshots of the additive manufacturing simulation processes of the sandwich specimens. |
| In the text | |
|
Fig. 2 Bending tests, (a) example of specimens, (b) 3-point bending setup (b: support spacing). |
| In the text | |
|
Fig. 3 Nanoindentation modelling, (a) axisymmetric finite element model, (b) load-displacement curve. |
| In the text | |
|
Fig. 4 Modelling of the sandwich structures with auxetic and honeycomb core (My: bending moment). |
| In the text | |
|
Fig. 5 Result of filament tensile tests. |
| In the text | |
|
Fig. 6 Measurement of melt flow rate and melt volume-flow rate. |
| In the text | |
|
Fig. 7 Results of FTIR analyses of the filaments. |
| In the text | |
|
Fig. 8 Differential scanning calorimetry of the filaments, (a) first heating, (b) second heating. |
| In the text | |
|
Fig. 9 Dilatometer measurements of printed structures. |
| In the text | |
|
Fig. 10 Results of nanoindentation tests. |
| In the text | |
|
Fig. 11 Bending test results of geometries G1 and G2, (a) examples of measured bending forces, (b) summary of maximum bending force values, (c) examples of specimens after bending until fracture. |
| In the text | |
|
Fig. 12 Bending test results of geometry G3, (a) examples of measured bending forces, (b) summary of maximum bending force values, (c) example of intermediate stages during bending. |
| In the text | |
|
Fig. 13 Material parameter identification by nanoindentation, (a) load-displacement curves, (b) simulation result of equivalent stress (σe) and equivalent plastic strain (εe) distribution. |
| In the text | |
|
Fig. 14 Comparison of normalised bending moment versus normalised displacement of the auxetic cell simulation and experimental 3-point-bending tests. |
| In the text | |
|
Fig. 15 Results of Finite Element simulation in the tensioned face sheet of the outer bend of the bent part for the G1 and G2 core structure. |
| In the text | |
|
Fig. 16 Simulation results on the influence of different wall thicknesses in the tensioned face sheet of the outer bend of the bent part of the auxetic core structure, (a) Star-4 wall thicknesses, (b) distribution of σe, (d) σe along x- and y-direction. |
| In the text | |
Current usage metrics show cumulative count of Article Views (full-text article views including HTML views, PDF and ePub downloads, according to the available data) and Abstracts Views on Vision4Press platform.
Data correspond to usage on the plateform after 2015. The current usage metrics is available 48-96 hours after online publication and is updated daily on week days.
Initial download of the metrics may take a while.