| Issue |
Manufacturing Rev.
Volume 8, 2021
|
|
|---|---|---|
| Article Number | 11 | |
| Number of page(s) | 8 | |
| DOI | https://doi.org/10.1051/mfreview/2021009 | |
| Published online | 14 April 2021 | |
Research Article
Simulation of dynamic recrystallization of a magnesium alloy with a cellular automaton method coupled with adaptive activation energy and matrix deformation topology
School of Materials Science and Engineering & National Key Laboratory for Precision Hot Processing of Metals, Harbin Institute of Technology, Harbin 150001, China
* e-mail: This email address is being protected from spambots. You need JavaScript enabled to view it.
; This email address is being protected from spambots. You need JavaScript enabled to view it.
Received:
11
December
2020
Accepted:
1
March
2021
Abstract
The cellular automata (CA) model combining topological deformation and adaptive activation energy was successfully constructed to analyze the thermal dynamic recrystallization of the magnesium alloy (AZ61). The simulation datum shown that the recrystallization nucleation located on the grain boundary (GB) once the density of dislocation accumulated to specific value, and the result presents a typical characteristics i.e., repeated nucleation and growth. The simulation results agree well with the experimental results because the activation energy affects recrystallization by affecting nucleation rate.
Key words: AZ61 magnesium alloy / cellular automaton / adaptive activation energy / deformation topology / dynamic growth criterion
© S. Wang et al., Published by EDP Sciences 2021
 This is an Open Access article distributed under the terms of the Creative Commons Attribution License (https://creativecommons.org/licenses/by/4.0), which permits unrestricted use, distribution, and reproduction in any medium, provided the original work is properly cited.
1 Introduction
With increased demands for reducing structure weight as well as reducing energy consumption in aviation and automobile industries, magnesium (Mg) alloys are attracting increased attention due to their excellent properties such as lightweight and high specific strength [1–4]. While these structural components are achieved largely through using forming processes, study of Mg alloys thermal deformation behavior and microstructure evolution is a prerequisite for ensuring to produce high-performance workpieces of Mg alloys.
Bajargan et al. [5] and Xu et al. [6] studied The hot deformation behavior of AZ31/AZ61 Mg alloy, respectively. Recently, Kugler and Turk [7] established the recrystallization kinetics model of isothermal compression, and analyzed the relationship between the average grain size and dynamic recrystallization (DRX) process. Zhang et al. [8], Guo and Ding [9] and Turk and Kugler [10] studied the DRX process by two-dimensional CA model.
In the research reported in this paper, the focus was on the coupling effects of adaptive activation energy and matrix deformation topology on the DRX behavior of magnesium alloys.
2 Materials and methods
The experimental material for hot compression is commercial Mg alloy hot extruded bars (diameter 10 mm, length 500 mm) with nominal composition Mg-5.7Al-0.9Zn-0.5Mn (wt%). Before hot compression, the extruded-rods were heated to 400 °C and held for 4 h to obtain homogeneous microstructure (air cooling). The radius/height of the hot compression samples was 4/12 mm. All the tests of isothermal compression were performed on the thermal simulation testing machine (type: Gleeble-1500D). The range of temperature, strain rate and height reduction was 350–450 °C, 0.001–1 s−1 and 0–50%, respectively. The compression procedure is shown in Figure 1. In order to improve the temperature uniformity, the samples were held for 3 minutes before compression.
Each sample was cut along the axial section of the quenched specimens, and then mechanically polished and chemically etched for microstructure analysis. The etchant consisted of picric and acetic acid (27.5 g and 25 ml), distilled water and alcohol (50 and 450 ml). Microstructure results were detected by Olympus-GX71 optical microscope (OM) and Talos F200X transmission electron microscope (TEM). Mean grain size of initial hot compression specimens was 44.6 µm measured by quantitative metallographic method. The specific locations of microstructure simulations and experimental observations are in the central part of the samples.
 |
Fig. 1 Experimental procedure for hot compression test. |
3 CA models for dynamic recrystallization
3.1 Theoretical model
3.1.1 Modelling for dislocation evolution
The change of dislocation density ρ, with strain ε in the Kocks and Mecking model (K-M model) can be described by [9]: (1)where k1/k2 represents the hardening /dynamic softening parameter.
Based on the shear modulus G and the Burgers vector b, the flow stress σ can be calculated by [9]: (2)where the value of the interaction factor α' is 0.5–1.0. Based on N, the number of the total cells, and ρi, the mean ρ of all cells',
  , could be given by:
 (3)
(3)
3.1.2 Modelling for DRX nucleation and growth
Based on the strain rate  , temperature T and the universal gas constant R, the dynamic recrystallization nucleation rate could be given by [9]:
 (4)where C represents a constant determined by an inverse analysis method, and m denotes a strain rate sensitive exponent, which is usually set as 1.0 in the CA simulation according to Refs. [11–14]. The deformation activation energy Qact could be calculated by the result of hot compression experiments [15]. The nucleation rate
  can be inversely calculated by the following expression [10]:
 (5)
(5)
where rd represents the mean radius of the recrystallized grains, and η is the DRX percentage of experimentally result. The critical ρ of DRX during hot deformation could be calculated by [9]. (6)
(6)
where the symbol τ represents the line energy of dislocation, and symbol γ means the energy of grain boundary (GB), see equations (7) [8] and (8) [9]. The dislocation mean free path l and the mobility ratio M of GB was expressed by equations (9)–(11). (7)where the θi represents the ith recrystallized grain misorientation with its neighboring one, and θm means the high angle misorientation (taken as 15°).
 (8)where µ is the Poisson's ratio.
 (9)where the constant K1 is usually about 10 for most metals.
 (10)where K represents Boltzmann's constant. The δ, Qb and Dob are the characteristic grain boundary thickness, diffusion activation energy and diffusion factor, respectively.
3.1.3 Modelling of DRX growing
The driving force (Δfi) depends on the difference of ρm and ρd [10]: (11)
(11)
For the assumed spherical recrystallized grains: (12)where ri and ρd/ρm is the radius and ρ of recrystallized grain / matrix, respectively.
Displacement increment (Δxi) and time increment (Δt) could be calculated by equations (13) and (14): (13)
(13)
 (14)
(14)
In this study, the length and width of each cell are both set as the constant L0 in the hot compression process, the growth criterion can be written as: (15)where ni denotes the number of cells in the ith DRX grain.
3.2 Simulation conditions of solution-treated (ST) and as-rolled (AR) alloy
In this study, the total cell number is 160 000 (initial matrix size 400 × 400) in the CA model, which corresponds to 1000 μm × 1000 μm in a real sample. The length and width L0 of each cell is arbitrarily chosen to be 2.5 µm. Meanwhile, the Neumann's neighboring rule and periodic boundary conditions are applied in this CA simulation.
3.3 General model for matrix deformation
3.3.1 Matrix deformation theory
In this work, the grain shape is supposed to be spherical, which changes into an ellipsoid during the compression process. The deformation is described by the 2 × 2 matrix, thus the homogenous deformation matrix S can convert the vector u into v as follows: (16)
(16)
Based on the initial vector (ui (where, i = x,y)), new vector (vi (where, i = x,y)) and principle nominal deformation in x and y direction (li (where, i = x,y)), the matrix can be written as: (17)where li denotes the ratio of final length to the original length of the unit vector ahead the axes, and lxly = 1.
3.3.2 Matrix deformation model
The dimensions of initial matrix and deformed matrix are supposed to be a × b and m × n, respectively. Assuming that the area in 2D model remain constant during deformation, a × b = m × n. In the MATLAB model, LCA represents the length of each square cell. The initial matrix height is a × LCA, and the deformed matrix height is m × LCA, thus the true strain εt and engineering strain εe can be described as follows: (18)
(18)
 (19)
(19)
The relationship between εe and εt can be obtained by (20)
(20)
Then the rows m of deformed-matrix can be calculated by (21)
(21)
The columns n of deformed-matrix can be calculated by (22)
(22)
3.3.3 Matrix transformation
Figure 2a and b show the example of geometry change between initial and deformed grain due to matrix deformation in the compression process. It can be seen that there are 20 surrounding neighbors (shown in white dot) of the initial grain (green color), which increases to 22 neighbors after compression deformation, thus the DRX nucleation sites should become more. Therefore, in order to model the DRX process more accurately, the rule of matrix deformation is adopted in this study.
The coordinate of each cell with given orientation value, Ori, in the initial matrix should be transferred to a new one to match the deformed matrix. Meanwhile, the cells in an identical grain are assigned the same orientation value, Ori, to distinguish different grains, which means that the cells with the same Ori belong to the unique grain, otherwise not. The coordinate transformation could be described in equations (23) and (24): (23)
(23)
 (24)
(24)
where Ceil (X) is a numerical method to get a smallest integer not less than X. The variable i(i') and j(j') represent the initial matrix (deformed matrix) x and y ordinate, respectively. After deformation is finished, the orientation Ori (i, j) of the cell Si,j in the initial matrix S(a, b), i.e. matrix S with a rows and b columns, should be transferred to the cell S'i', j' in the deformed matrix S' (m, n), i.e. matrix S' with m rows and n columns. Figure 2b show the schematic diagrams of matrix deformation and grain topology under certain strain. There are 9 grains with different Ori (1–9) and colors in initial matrix, and each grain has four cells with the same Ori, as illustrated in Figure 2b. As the matrix deformation reaches 50%, the initial two-dimensional matrix S (6, 6) is changed into a new two-dimensional matrix S' (3, 12), and thus the geometry of initial matrix will change correspondingly. Meanwhile, the information of each cell in initial matrix is transferred to the corresponding cell in deformed matrix, respectively. For instance, cell S'2,5 corresponds to S4,3 and S'2,7 corresponds to S4,4 according to equations (23) and (24). Figure 2c displays the grains topology caused by matrix deformation with initial average grain size 44.5 μm, which is close to that in the solution treated AZ61 Mg alloy in this study.
 |
Fig. 2 Schematic diagram of grain topology with matrix deformation: (a) schematic diagram of geometry change due to matrix deformation, (b) schematic diagram of matrix deformation, εe = 0.5, (c) grain topology induced by matrix deformation, εe = 0.5, (initial average grain size d0 = 44.5 µm). |
4 Results and discussion
4.1 Hot compression strain-stress analysis
Figure 3 presents the experimental results of hot compression with the T of 350–450 °C. As the true strain enhanced, the stress increased dramatically and continuously. Beyond the maximum value, the stress reduced gradually and even to a steady state.
The adaptive activation energy Qact under different true strains ε were incorporated into the CA model. The Qact corresponding to ε varying from 0.05 to 0.7 were calculated with interval of 0.05. Through linear fitting of ln sinh(ασ) − 1/T and  , the activation energy Qact was calculated as 166 KJ. Based on the linear relationship of ln Z − ln sinh(ασ), where Z is the Zener-Hollomon parameter, the stress constant n of as-received AZ61 Mg alloy was calculated to be 8.7, and the correlation coefficient reached 0.908, which indicates that it was reliable to describe the hot deformation behavior of the Mg alloy by using hyperbolic sine law [1]. By means of least squares polynomial fitting of the deformation energy under various strains, the evolution of deformation energy Qact with true strain can be written as:
 (25)
(25)
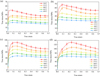 |
Fig. 3 Hot compression results of AZ61 magnesium alloy: (a) |


4.2 Microstructural evolution of simulaiton
Figure 4 exhibits the simulation results of microstructure evolution of AZ61 magnesium alloy under hot deformation (400 °C,  = 0.001 s−1).
 |
Fig. 4 AZ61 microstructure of simulation result under hot deformation with different ε (400 °C, |

4.3 Flow stress prediction using simulation
Figure 5 compares the peak stress and s one of the AZ61 magnesium alloy. There is little difference between the experimental datum and simulated ones.
 |
Fig. 5 Comparison between peak stress and steady stress by experimental and simulation of AZ61 magnesium alloy sample (T = 400 and 425 °C, |

4.4 Microstructure prediction during hot compression
Figure 6 presents the simulated and experimental microstructures of hot deformation samples under different T. Table 1 lists the average grain sizes of simulated and experimental results.
Figure 7 presents the variation curves of dynamic recrystallization, including volume fraction and average grain size. When the strain rate increased, the dislocation pile-up was more serious and the dislocation storage energy became greater, resulting in higher DRX nucleation rate and more recrystallized grains. However, the DRX grains did not have enough time to grow up under high strain rate, thus the grain size was smaller under high strain rate than that under low strain rate when the DRX process was completed. Also, it could be found that the mean grain size reduced once the dynamic recrystallization occurred. With the progress of hot compression, the DRX fraction increased gradually. Until the plastic strain reached certain value, the DRX process finished and then the DRX grains ceased to refine.
 |
Fig. 6 Microstructures comparison between CA simulation datum and experimental results and different T ( |

Average grain size of simulation and experimental results under true strain ɛ = 0.7.
 |
Fig. 7 The relationship between average grain size, strain rate, and recrystallization fraction (T = 400 °C, |

5 Conclusions
The CA model coupled with adaptive deformation energy and matrix deformation topology has been established to simulate the DRX process of AZ61 magnesium alloy in the temperature range of 350 ∼ 450 °C and the strain rate range of 0.001-1 s-1. The simulated peak stress and steady stress values were very close to the experimental ones. The deviation of the average grain size between the simulation and experimental results was less than 10%.
Meanwhile, the simulated DRX process as well as microstructure evolution was in good accordance with the experimental ones from the hot compression of AZ61 Mg alloy, which indicates the reliability of the present CA model coupled with adaptive activation energy and topology deformation technology.
The CA simulation results indicate that the decrease of strain rate accelerated the DXR process and the mean grain size increased with the decrease of strain rate, which was quite consistent with the experimental results of the hot compression.
Nomenclature
ρ: Dislocation density
ε: True strain
k1 : Hardening parameters
k2 : Softening parameters
Σ: Flow stress
G: Shear modulus
b: Burgers vector
 :
Mean dislocation density of all cells
:
Mean dislocation density of all cells
ρi : Dislocation density of Number i cell
N: The number of total cells
 :
Nucleation rate
:
Nucleation rate
C: Constant
m: Strain rate sensitive exponent, set as 1.0
Qact : Deformation activation energy
R: Universal gas constant, 8.31
T: Deformation temperature
 :
Strain rate
:
Strain rate
A0 : Material constants
n: Material constants
α: Material constants
η: DRX percentage
rd: Mean radius of recrystallized grains
ρc: Critical dislocation density
γ: Grain boundary energy
l: Dislocation mean free path
M: Grain boundary mobility ratio
θi : grain boundary misorientation
γm : Grain boundary energy
θi : Grain boundary misorientation between the ith recrystallized grain and its neighboring grain
θm : Grain boundary misorientation in the case of the occurrence of a high angle boundary (taken as 15°)
µ: Poisson's ratio
K1 : Constant of 10 for most metals
δ: Characteristic grain boundary thickness
Dob : Boundary self-diffusion coefficient
K: Boltzmann's constant
Qb : Activation energy for the boundary diffusion.
vi : Growth velocity
Δfi : Driving force for the ith recrystallized grain
ρm : Dislocation density of the matrix
ρd : Dislocation density of recrystallized grain
ri : The radius of the ith recrystallized grain
Δxi : Displacement increment of ith recrystallized grain
Δt: Time increment
L0 : Length of each cell
ni : The numbers of cells in the ith DRX grain
ui (i = x,y): Initial vector of x and y direction
vi (i = x,y): New vector of x and y direction after deformation
li (i = x,y): Length in x, y axes of deformed matrix
εe: Engineering strain
εt: True strain
a × b: Cell number of row × column (initial matrix)
m × n: Cell number of row × column (deformed matrix)
ceil(x): map a the smallest integer not less than x
σp : Peak stress
εc: Critical strain
εp: Peak strain
k: Material constants
θ: Strain hardening
σss : Steady-state stress
XDRX : Dynamic recrystallization fraction
Author contribution
Wenchen Xu, Writing-Review & Editing; Sibing Wang, Writing-Original Draft Preparation, He Wu, Data curation; Ranxu Yuan, software; Xueze Jin, performed the experiments and Data curation; Debin Shan, Supervision.
Acknowledgments
This work is supported by the National Natural Science Foundation of China (No. 51775137).
References
- H. Yu, Y. Sun, L. Hu, Z. Wan, H. Zhou, J. Alloys Compd. 704 (2017) 537–544 [Google Scholar]
- S.-M. Baek, H.J. Kim, H.Y. Jeong, S.-D. Sohn, H.-J. Shin, K.-J. Choi, K.-S. Lee, J.G. Lee, C.D. Yim, B.S. You, H.-Y. Ha, S.S. Park, Corros. Sci. 112 (2016) 44–53 [Google Scholar]
- O. Hilšer, S. Rusz, P. Szkandera, L. Čížek, M. Kraus, J. Džugan, W. Maziarz, Metals 8 (2018) 776 [Google Scholar]
- C.-C. Zhang, H.-Y. Wang, M. Zha, C. Wang, J.-H. Li, Z.-Z. Yang, Q.-C. Jiang, Materials 11 (2018) 895 [Google Scholar]
- G. Bajargan, G. Singh, D. Sivakumar, U. Ramamurty, Mater. Sci. Eng. A 579 (2013) 26–34 [Google Scholar]
- Y. Xu, L. Hu, Y. Sun, J. Alloys Compd. 580 (2013) 262–269 [Google Scholar]
- G. Kugler, R. Turk, Comput. Mater. Sci. 37 (2006) 284–291 [Google Scholar]
- Y. Zhang, S. Jiang, Y. Liang, L. Hu, Comput. Mater. Sci. 71 (2013) 124–134 [Google Scholar]
- R. Ding, Z.X. Guo, Comput. Mater. Sci. 23 (2002) 209–218 [Google Scholar]
- G. Kugler, R. Turk, Acta Mater. 52 (2004) 4659–4668 [CrossRef] [Google Scholar]
- H.J. McQueen, N.D. Ryan, Mater. Sci. Eng. A 322 (2002) 43–63 [CrossRef] [Google Scholar]
- R. Ding, Z.X. Guo, Acta Mater. 49 (2001) 3163–3175 [CrossRef] [Google Scholar]
- S. Hore, S.K. Das, S. Banerjee, S. Mukherjee, Mater. Sci. Technol. 28 (2012) 711–718 [Google Scholar]
- P. Peczak, M.J. Luton, Philos. Mag. 70 (1994) 817–849 [Google Scholar]
- Z. Jin, Z. Cui, Comput. Mater. Sci. 63 (2012) 249–255 [CrossRef] [Google Scholar]
Cite this article as: Sibing Wang, Wenchen Xu, He Wu, Ranxu Yuan, Xueze Jin, Debin Shan, Simulation of dynamic recrystallization of a magnesium alloy with a cellular automaton method coupled with adaptive activation energy and matrix deformation topology, Manufacturing Rev. 8, 11 (2021)
All Tables
Average grain size of simulation and experimental results under true strain ɛ = 0.7.
All Figures
|
Fig. 1 Experimental procedure for hot compression test. |
| In the text | |
|
Fig. 2 Schematic diagram of grain topology with matrix deformation: (a) schematic diagram of geometry change due to matrix deformation, (b) schematic diagram of matrix deformation, εe = 0.5, (c) grain topology induced by matrix deformation, εe = 0.5, (initial average grain size d0 = 44.5 µm). |
| In the text | |
|
Fig. 3 Hot compression results of AZ61 magnesium alloy: (a) |
| In the text | |
|
Fig. 4 AZ61 microstructure of simulation result under hot deformation with different ε (400 °C, |
| In the text | |
|
Fig. 5 Comparison between peak stress and steady stress by experimental and simulation of AZ61 magnesium alloy sample (T = 400 and 425 °C, |
| In the text | |
|
Fig. 6 Microstructures comparison between CA simulation datum and experimental results and different T ( |
| In the text | |
|
Fig. 7 The relationship between average grain size, strain rate, and recrystallization fraction (T = 400 °C, |
| In the text | |
Current usage metrics show cumulative count of Article Views (full-text article views including HTML views, PDF and ePub downloads, according to the available data) and Abstracts Views on Vision4Press platform.
Data correspond to usage on the plateform after 2015. The current usage metrics is available 48-96 hours after online publication and is updated daily on week days.
Initial download of the metrics may take a while.